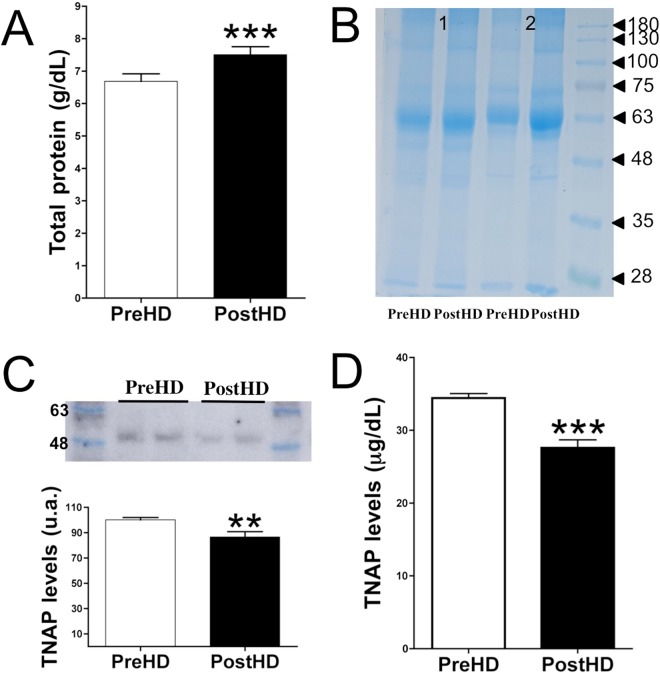
Figure 5.
Loss of TNAP protein in post-dialysis plasma. (A) Total protein concentrations in plasma samples before and after dialysis. (B) Representative Coomassie Brilliant Blue staining of plasma proteins in two pairs of samples. (C) Representative immunoblot of TNAP levels in plasma samples before and after dialysis (upper), and relative level of TNAP level in post-dialysis relative to pre-dialysis samples (lower). (D) ELISA quantification of TNAP levels in plasma samples before and after dialysis. Results are presented as mean ± SEM of 40 pairs of samples, and were compared using the Wilcoxon matched pairs test. **P < 0.01; ***P < 0.001.

