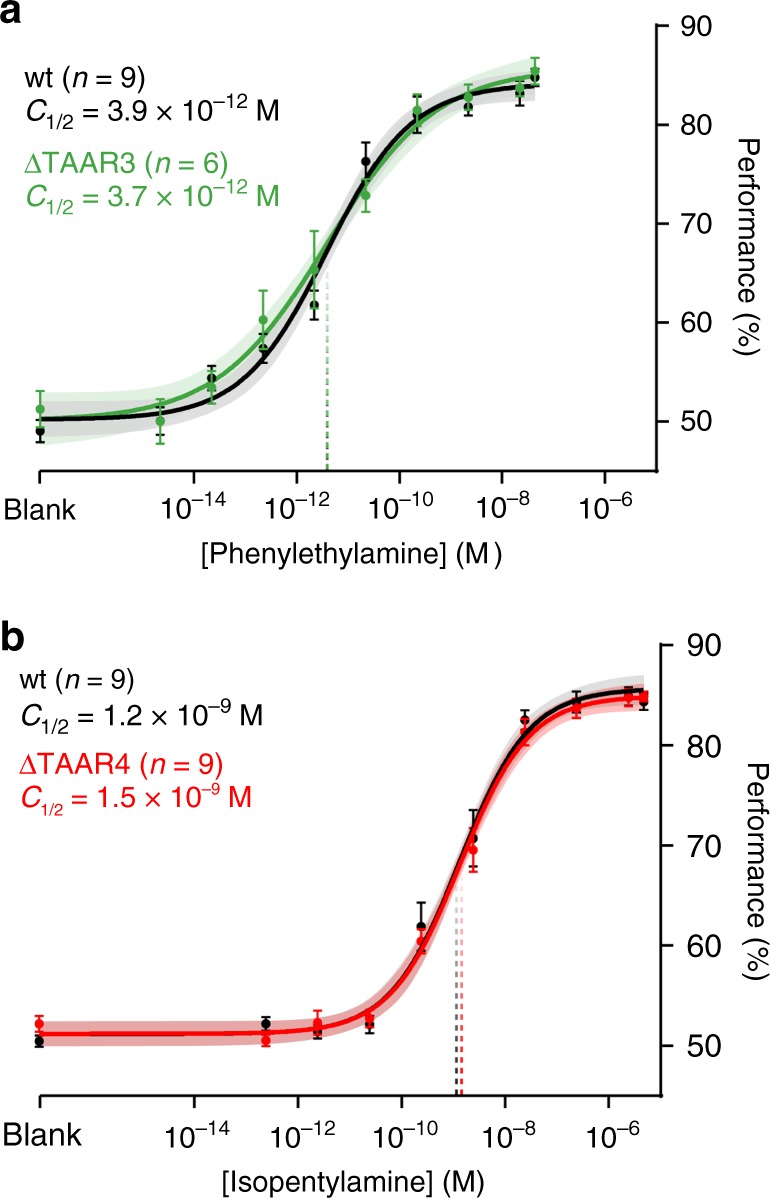
Fig. 5.

Deletion of single TAARs does not impact sensitivity to non-preferred ligands. a Psychometric curves of wild-type (black) and TAAR4 deletion littermates (red) to isopentylamine. b Psychometric curves of wild-type (black) and TAAR3 deletion littermates (green) to phenylethylamine. Plots show mean +/− SE with a shaded 95% confidence interval. Data were fitted using a Hill function. Behavioral sensitivity is defined as the odor concentration at half-maximal behavioral performance (C½) during a head-fixed Go/No-Go conditioned assay. Phenylethylamine: wt C½ = 3.9 × 10⁻¹² M (95% CI = 2.0–7.1 × 10⁻¹²); ΔT3 C½ = 3.7 × 10⁻¹² M (95% CI = 1.1–12.5 × 10⁻¹²). Isopentylamine: wt C½ = 1.2 × 10⁻⁹ M (95% CI = 0.6–1.9 × 10⁻⁹ M); ΔT4 C½ = 1.5 × 10⁻⁹ M (95% CI 0.9–2.3 × 10⁻⁹ M)
