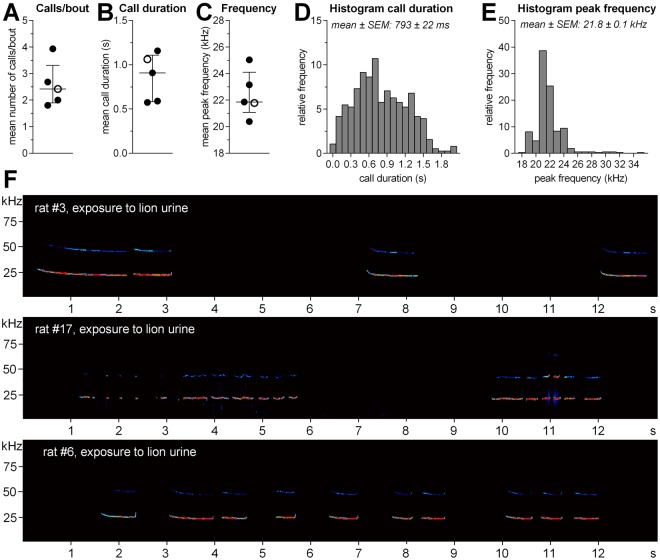
Figure 4.
Acoustic parameters of 22-kHz calls induced by exposure to predator urine samples. (A) Mean number of calls per bout, (B) mean call duration, and (C) mean peak frequency of the calls. The horizontal lines indicate the medians and the interquartile ranges (open circle = exposure to fox urine; filled circle = exposure to lion urine). Histograms depicting the distribution of call duration (D) and peak frequency (E) of all calls recorded during exposure to the different predator urine samples (n = 383), bin widths: 0.2 s and 1 kHz, respectively. (F) Exemplary spectrograms showing examples of the recorded 22-kHz calls from three different rats. The colours code the intensity of the calls (intensity correlates with warmness of the colour).

