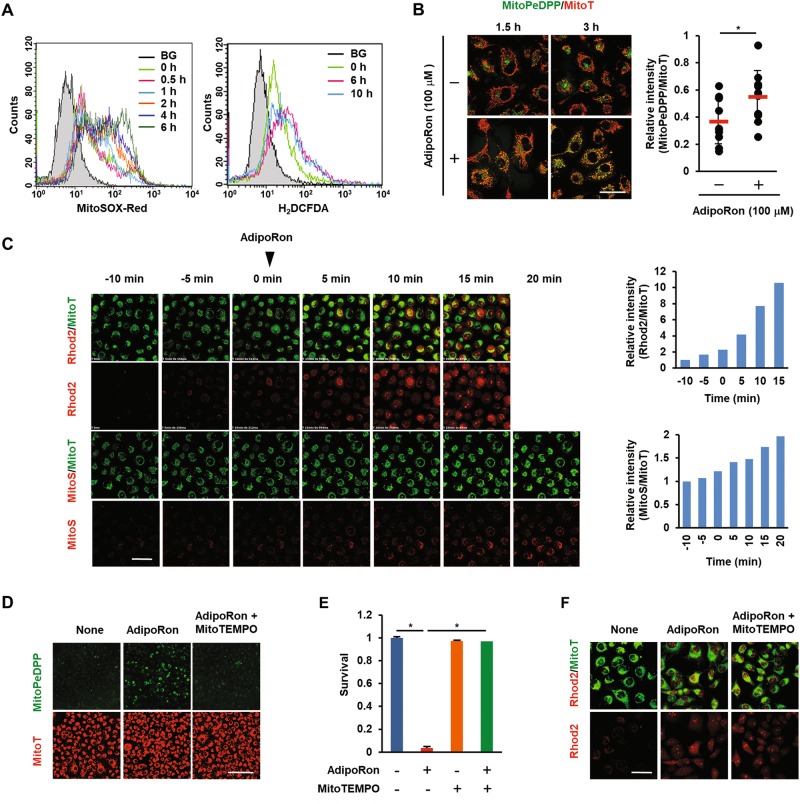
Fig. 4. Effects of AdipoRon on mtROS production, lipid peroxidation and [Ca2+]mt level in MIAPaCa-2 cells.
a Mitochondrial and intracellular ROS production. The cells were treated with vehicle alone or 100 μM AdipoRon for the indicated times. Mitochondrial ROS and intracellular ROS were examined by FACS after staining the cells with MitoSOX Red and H2DCF-DA, respectively. BG: background. b Mitochondrial lipid peroxidation. The cells were treated with vehicle alone or 100 μM AdipoRon for 1.5 h or 3 h. Lipid peroxidation was evaluated by staining the cells with MitoPeDPP. Bar: 50 μm. The pixel values of MitoPeDPP and MitoT on 3 h-images were calculated for each cell to determine the relative fluorescence intensity using the ImageJ software. c [Ca2+]mt level. Time-lapse imaging was used to evaluate [Ca2+]mt and mtROS levels. For [Ca2+]mt, the cells were loaded with Rhod2-AM and MitoTracker Green (MitoT). For mtROS, the cells were loaded with MitoSOX Red (MitoS) and MitoTracker Green (MitoT). AdipoRon (100 μM) was added at 0 min. Bar: 50 μm. The pixel values of Rhod2 or MitoS and MitoT were calculated for each cell to determine the relative fluorescence intensity using the ImageJ software. d Effect of MitoTEMPO on AdipoRon-induced lipid peroxidation. The cells treated with 100 μM AdipoRon in the absence or presence of 10 μM MitoTEMPO for 3 h were stained with MitoPeDPP and MitoTracker Red (MitoT). Bar: 500 μm. e Effect of MitoTEMPO on AdipoRon-induced cell death. The cells were treated with 100 μM AdipoRon in the absence or presence of 10 μM MitoTEMPO for 40 h. f Effect of MitoTEMPO on AdipoRon-induced [Ca2+]mt accumulation. The cells pre-treated with 10 μM MitoTEMPO for 1 h were loaded with Rhod-2AM and MitoTracker Green (MitoT). The images were taken 10 min after the addition of AdipoRon (100 μM). Bar: 50 μm. For e, error bars represent standard deviation. *P < 0.001 by ANOVA test

