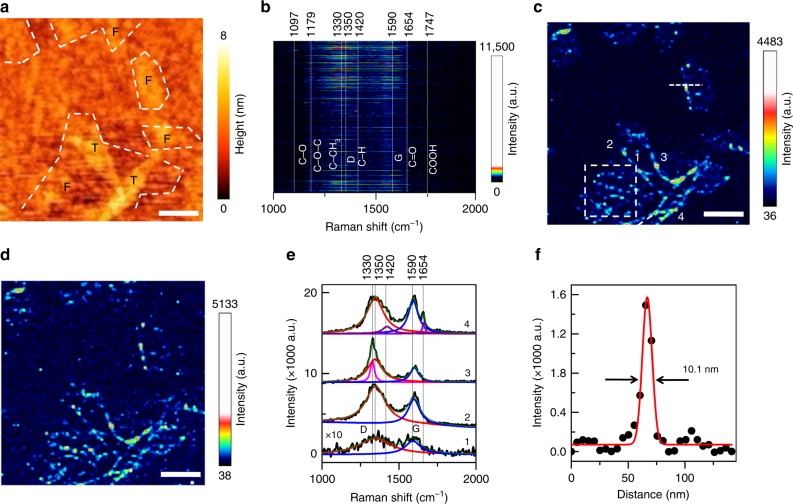
Fig. 2.
High-resolution TERS mapping of a GO–COOH flake. a Topography map of a multilayer GO–COOH sample obtained whilst TERS mapping. “T” and “F” refer to thick-layer and few-layer GO–COOH flakes, respectively. b Image of the stacked TERS spectra measured from 100 × 100 pixels across the GO–COOH sample area shown in (a). TERS spectra are stacked in the order of their acquisition with the 1st and the 10,000th TERS spectrum presented at the bottom and top of the image, respectively. TERS maps of c D band (1350 cm−1) intensity and d G band (1590 cm−1) intensity measured from the GO–COOH sample area shown in (a). Nominal pixel dimension: 10 nm. Integration time: 0.4 s. e TERS spectra measured at the locations marked 1–4 in (c) along with the fitted Lorentzian curves. The intensity of the averaged TERS spectrum from location 1 has been multiplied by 10 for easier visualisation. f TERS intensity profile along the white dashed line marked in (c) fitted with a Gaussian curve. All scale bars: 200 nm

