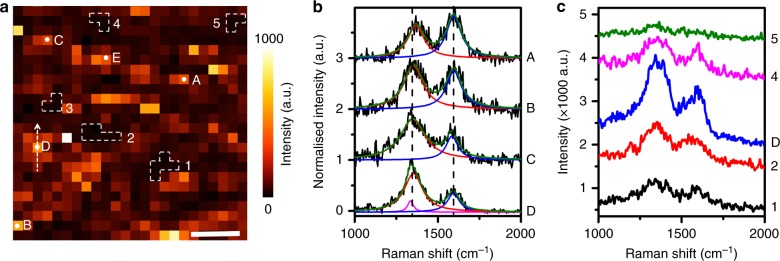
Fig. 3.
Visualising structural defects and functional groups on the GO–COOH surface at the nanoscale. a Zoomed-in TERS map of D band intensity from 250 × 250 nm2 area marked with a dashed square in Fig. 2c. Scale bar: 50 nm. b TERS spectra measured at the locations marked as A–D in (a). c TERS spectra measured at five pixels along the arrow marked across location D in (a). Note that the area of the TERS map in (a) is only around 0.5 % of the diffraction limited laser spot area for our confocal Raman microscope

