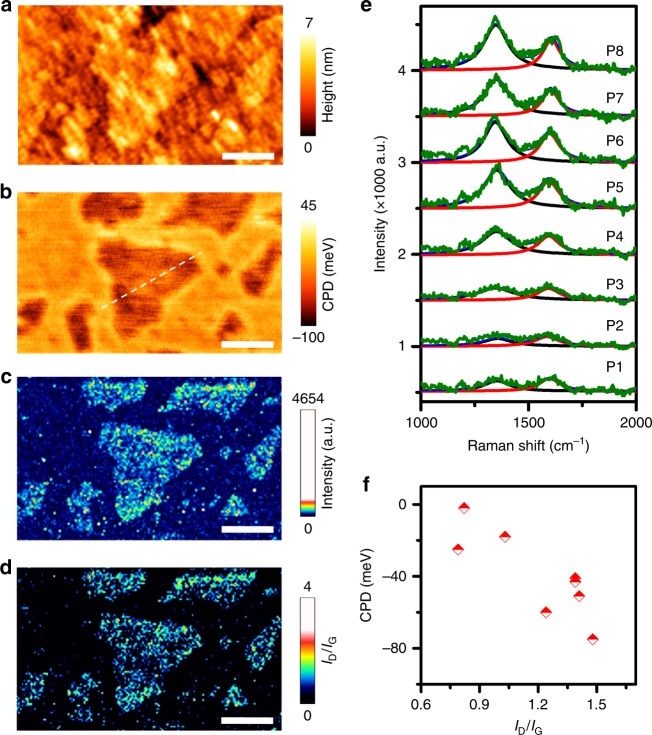
Fig. 4.
In situ topographical, chemical and electrical nanoscopy of GO–COOH. a Topography map of a few-layer GO–COOH sample obtained whilst TERS mapping. b CPD map, c TERS map of D band (1350 cm−1) intensity and d ID/IG ratio map measured in the region shown in (a). Area: 2.5 × 1.7 µm2. Step size: 16.7 nm. Integration time: 75 ms/pixel. e Averaged TERS spectra from the 8 different locations marked as P1–P8 in Supplementary Fig. 15 fitted with two Lorentzian curves. f Plot of CPD as a function of ID/IG ratio calculated from the averaged TERS spectra shown in (e) showing an inverse correlation between local defect density and Fermi level on the GO–COOH surface. All scale bars: 500 nm

