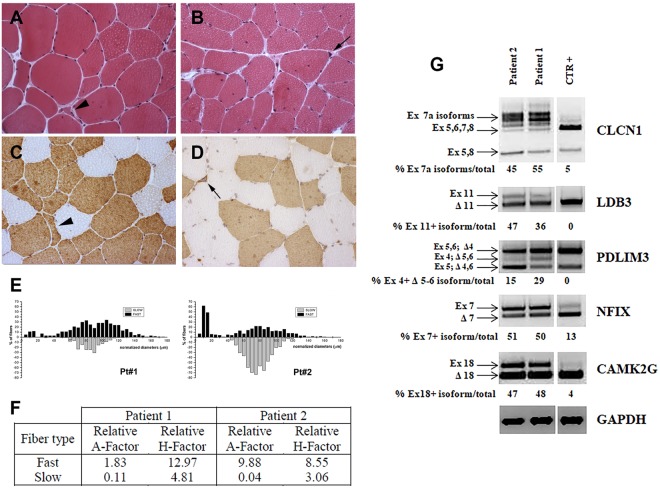
Figure 1.
Histopathology, immunocytochemistry and splicing analysis. (A–D) Histopathological analysis of biceps brachii biopsy obtained from patient 1 (A,C) and patient 2 (B,D). Haematoxylin and eosin (A,B) demonstrates a variation in fiber size with atrophic fibers (arrowhead), central nuclei and pycnotic nuclear clumps (black arrow) in both patients. Immunostaining (C,D) shows that atrophic fibers (arrowhead) and nuclear clumps (black arrow) are fast myosin positive. (E) Metahistograms obtained from the analysis of muscle fiber diameters in patient 1 and patient 2 on sections immunostained for MHCf or MHCs. Type 2 fiber atrophy is present in both patients but more evident in patient 2. Marked hypertrophy of both type 1 and type 2 fibers is particularly evident in patient 1. (F) Table shows the relative atrophy (A) or hypertrophy (H) factor in patient 1 and patient 2. (G) Panel showing the RT-PCR splicing analysis of skeletal muscle chloride channel (CLCN1), LIM Domain Binding 3 (LDB3), α-actinin-associated LIM protein 3 (PDLIM3), nuclear factor 1X (NFIX), calcium/calmodulin-dependent protein kinase II gamma (CAMK2G) genes in muscle from patients 1 and 2 and in a healthy subject (CTR). Due to the presence of samples not related to this study, the figure panel is composed by cropped images originating from the same gel. Details on how RT-PCR alternative splicing analysis was performed is reported in Materials and Methods. Alternatively spliced exons analyzed for each gene and the relative percentage of abnormal isoforms are indicated.

