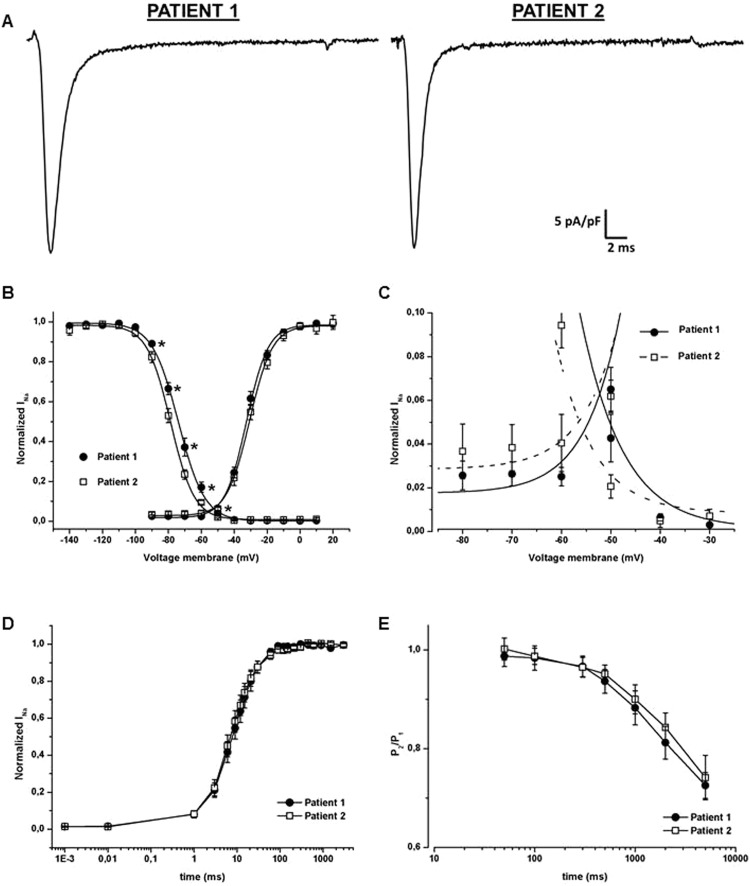
Figure 2.
Functional characterization of sodium current in myoblasts derived from the two patients. (A) Representative peak currents evoked by a stimulus of −10 mV and normalized by cell capacitance; sodium current density was similar between patient 1 (proband) and patient 2 (mother). (B) Steady-state activation (right) and fast inactivation (left) curves. No significant difference was found in the conductance-voltage relationships of the two patients (n = 13 in patient 1 and n = 9 in patient 2). A significant shift of about 5 mV in the positive direction was instead observed considering the steady-state fast inactivation curve of patient 1 (filled symbols, n = 16) compared to patient 2 (empty symbols, n = 9). (C) Enlargement of the portion of the overlapping curves of panel B to highlight the increased window current. (D) Recovery from fast inactivation. Peak current amplitude was normalized to the fully recorded current and plotted as function of time after imposition of the conditioning pulse. Overlapping curves were obtained for patients 1 (n = 17) and 2 (n = 14). (E) Entry into slow inactivation. Time dependence of the onset of slow inactivation was measured using a two pulse protocol, the resulting P2/P1 ratio was plotted against the P1 duration. The two obtained curves did not show any significant differences among the proband (n = 8) and his mother (n = 10). In the figure *p < 0.05.

