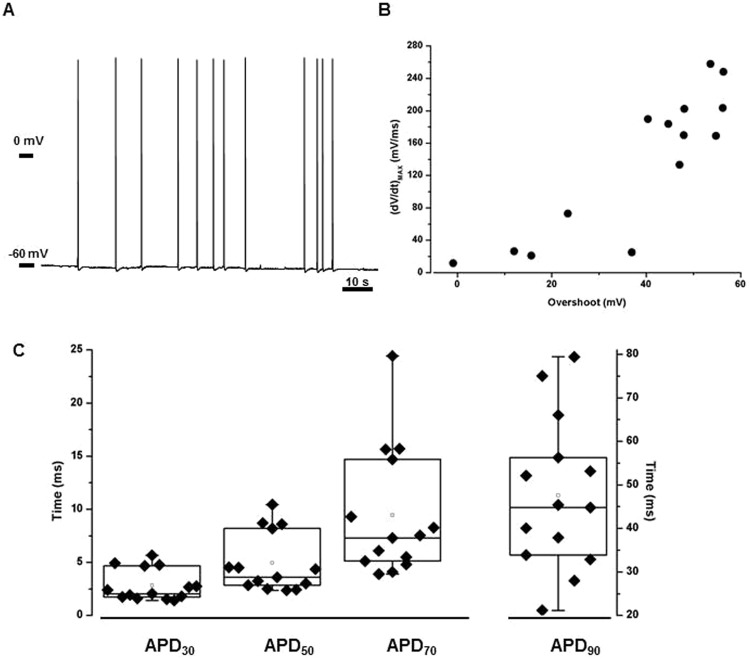
Figure 3.
Spontaneous activity in myotubes from patient 1. (A) Representative recording of spontaneous APs. When voltage membrane was unstable, firing frequency was not homogeneous either among the different cells and also within a single cell recording. (B) Uprising phase slope/overshoot relationship. Although the characteristics of spontaneous APs lay in an heterogeneous range of values, (dV/dt)MAX measured during in the phase 0 of an AP could be related to the overshoot of the same AP (n = 14). (C) Variability of APD30, APD50, APD70 and APD90 in spontaneous action potentials (n = 14). Each filled symbol represents a single myotubes, box plots contain data between percentile 25 and 75, the straight line and the white dot sets the median and the mean values respectively.

