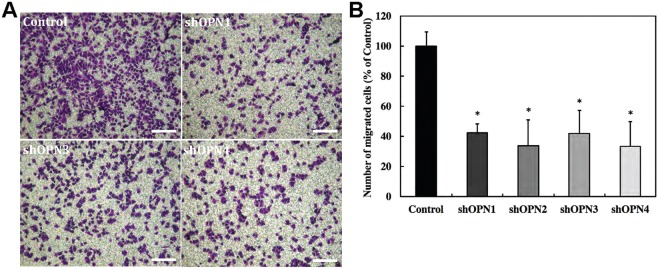
Figure 4.
Silencing of OPN gene results in reduction of in vitro migration potential of the knockdown clones. (A) Representative bright-field images showing crystal violet stained membranes of transwell inserts for the four stably silenced clones and vector control. The scale bars represent 200 µm. (B) Bar plot showing mean and standard deviation of number of migrated cells for stably silenced clones as percentage of vector control. Conventional Student t test threshold (p < 0.05) was considered statistically significant and is indicated by *.

