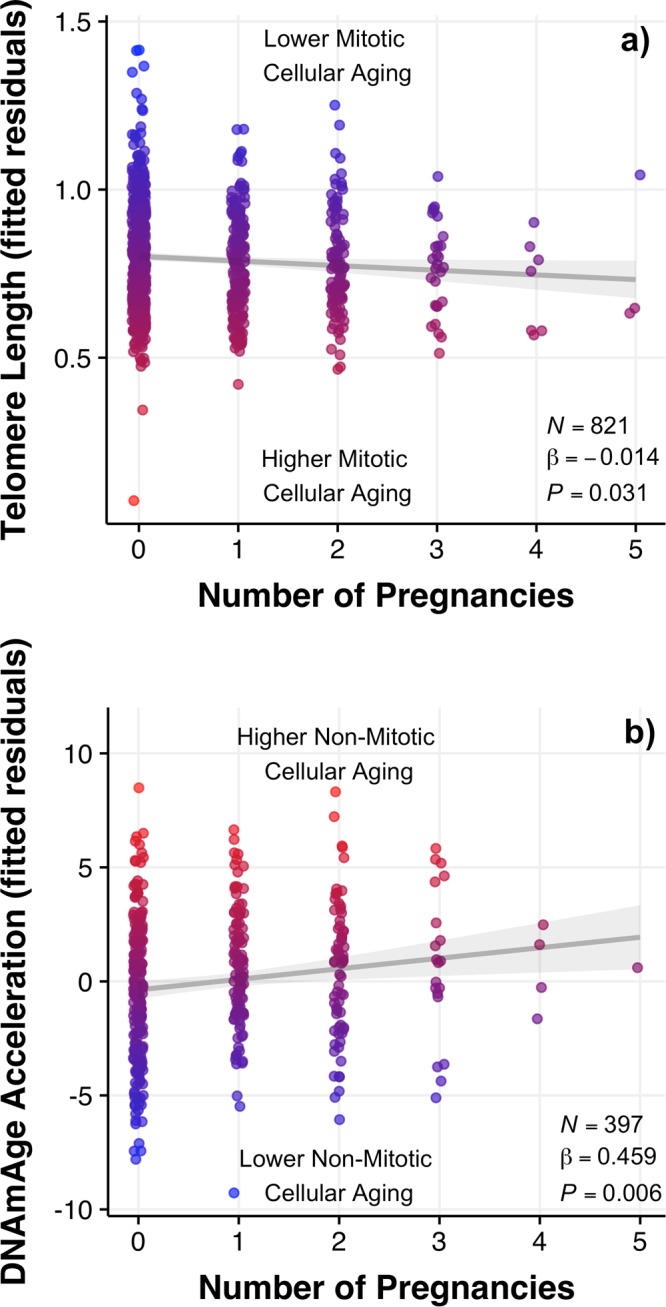
Figure 1.

Relationship between mitotic (TL) and non-mitotic (DNAmAge acceleration) measures of cellular aging and reproductive history (number of pregnancies) in young women. (a) Residualized TL for all variables in Table 2, Model 3, and statistics from same model. (b) Residualized DNAmAge for all variables in Table 2, Model 7, and statistics from same model. Graphs are labeled and dots are colored by relative aging for each marker (blue, low; red, high) and best fit lines are drawn with 95% CI of beta value.
