Figure 1.
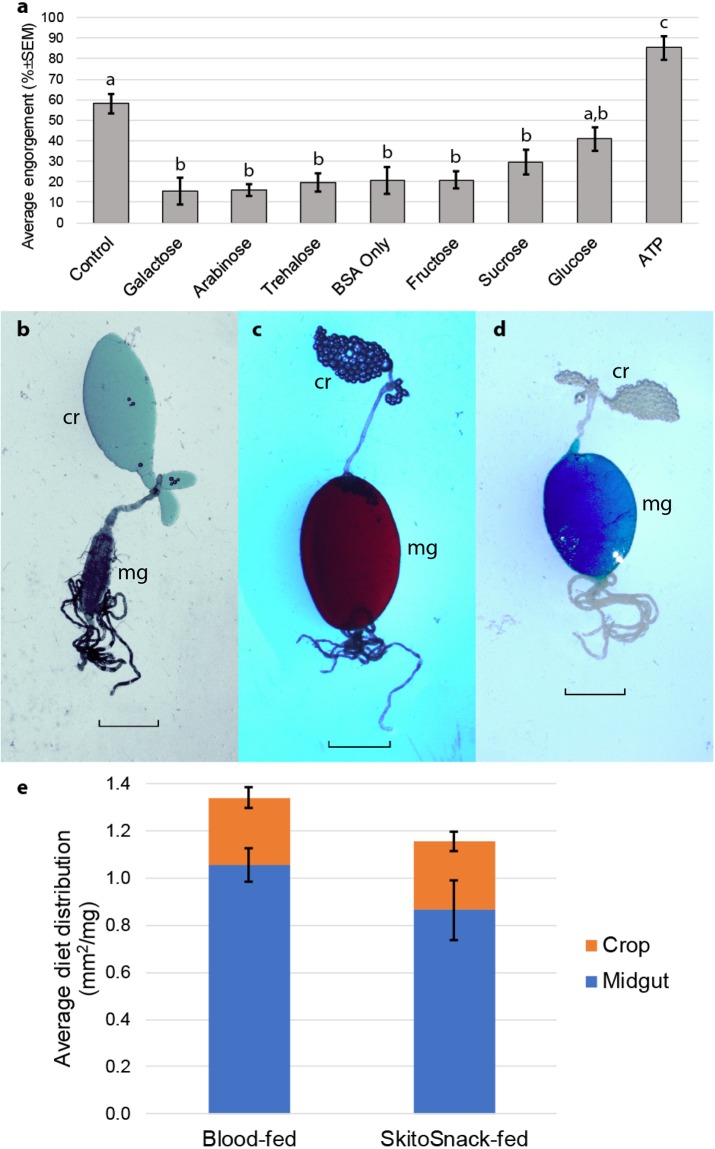
Effectiveness of phagostimulants and meal distribution within the mosquito alimentary canal. ta) Average percent engorgement rates of Ae. aegypti offered bovine blood (control), BSA only (in mAPS buffer and no phagostimulant), and BSA meals supplemented with galactose [50 mM], arabinose [50 mM], trehalose [50 mM], fructose [50 mM], sucrose [50 mM], glucose [50 mM], and ATP [3 mM]. Bars are arranged from weakest to strongest phagostimulant and represent average percent engorgement of at least 3 replicates ± SEM. Different letters indicate a statistical significant difference (p = 0.05 or less). (b–d) Alimentary canal showing crop (cr) and midgut (mg) of (b) females fed on sugar, (c) females fed on blood, and (d) females fed on SkitoSnack (blue hue is the result of the addition of food dye). Scale bar represents 1 mm. (e) Diet distribution of a bovine blood or SkitoSnack meal offered to 12th generation blood-raised or SkitoSnack-raised females. To account for body scaling anomalies, the area of the midgut and crop were divided by individual body weight. Bars represent average area of midgut or crop (mm2) per body weight (mg) ± SEM of least 4 replicates.

