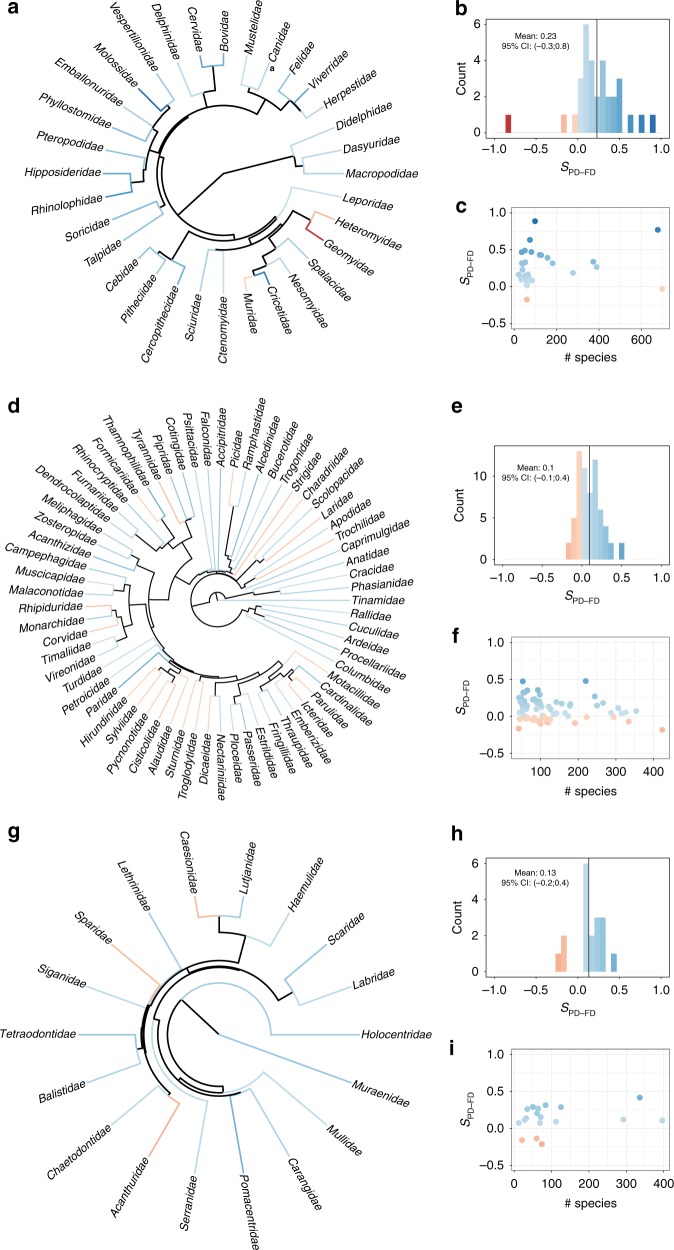
Fig. 3.
PD is a good surrogate for FD across clades. The figure presents the distribution and correlates of SPD–FD for mammals (a–c), birds (d–f) and fishes (g–i) across families. For each of the three groups, the SPD–FD frequency distribution is presented (b, e) along with its mean (vertical line). The color scheme is common to all panels. SPD–FD phylogenetic distribution is presented in panels a, d and g. Relationships between SPD–FD and species pool richness are presented in panels c, f, and i. For each taxonomic family, SPD–FD values are based on the mean over 1000 repetitions of random and maxPD set draw (there is only one maxFD set). The animal silhouette images in this figure were created by the corresponding author in Adobe Acrobat

