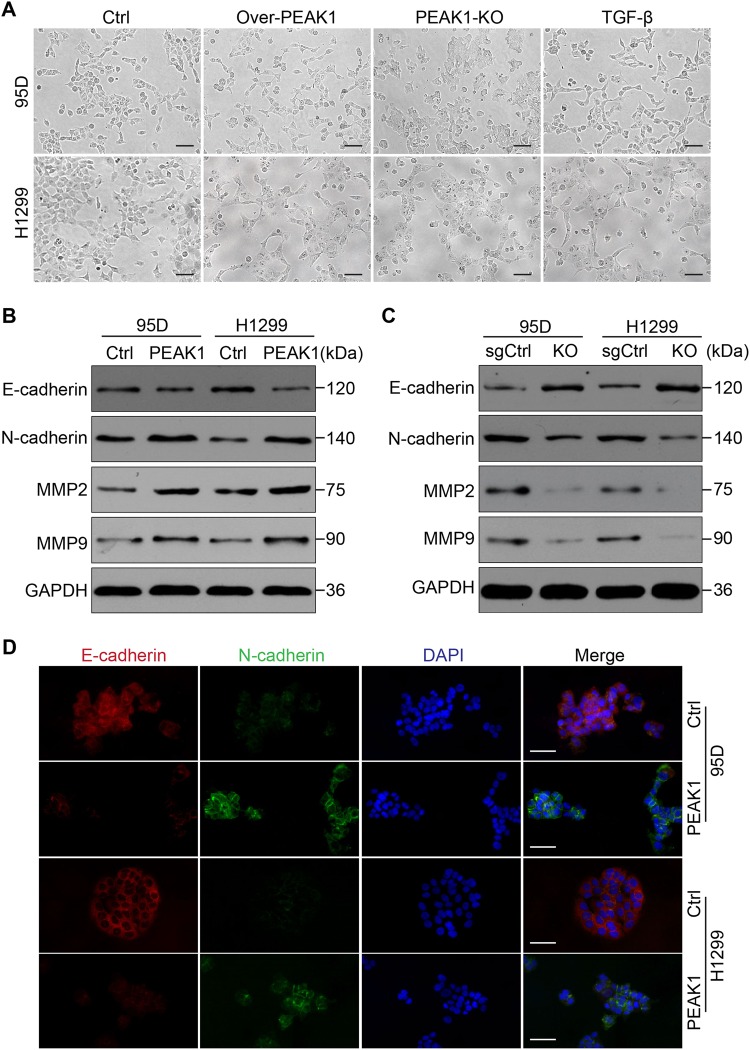
Fig. 2. PEAK1 expression promotes EMT in NSCLC cells.
a Morphological changes induced by PEAK1 expression in 95D and H1299 cells compared with TGF-β (10 ng/ml) treatment for 24 h. Scale bar, 100 μm. b Western blot showing decreased E-cadherin expression and increased N-cadherin expression, MMP2 and MMP9 expression in 95D-PEAK1 and H1299-PEAK1 cells compared with the corresponding control cells. c Western blot assay of E-cadherin, N-cadherin, MMP2 and MMP9 expression in 95D-sgCtrl, 95D-KO, H1299-sgCtrl and H1299-KO cells. d Immunofluorescence assay for E-cadherin and N-cadherin expression in 95D-Ctrl, 95D-PEAK1, H1299-Ctrl and H1299-PEAK1 cells. Scale bar, 150 μm

