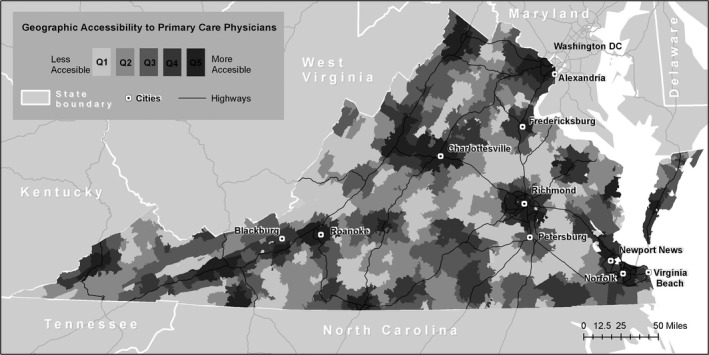
Figure 2.

- Notes. This map displays the distribution of the E2SFCA‐based measure of the primary care physician to population ratio across Virginia ZCTAs. The quintile ranges are as follows: quintile 1, less than 0.282; quintile 2, greater than or equal to 0.282 and less than 0.441; quintile 3, greater than or equal to 0.441 and less than 0.641; quintile 4, greater than or equal to 0.641 and less than 0.941; and quintile 5, greater than or equal to 0.941.
