
Figure 1.
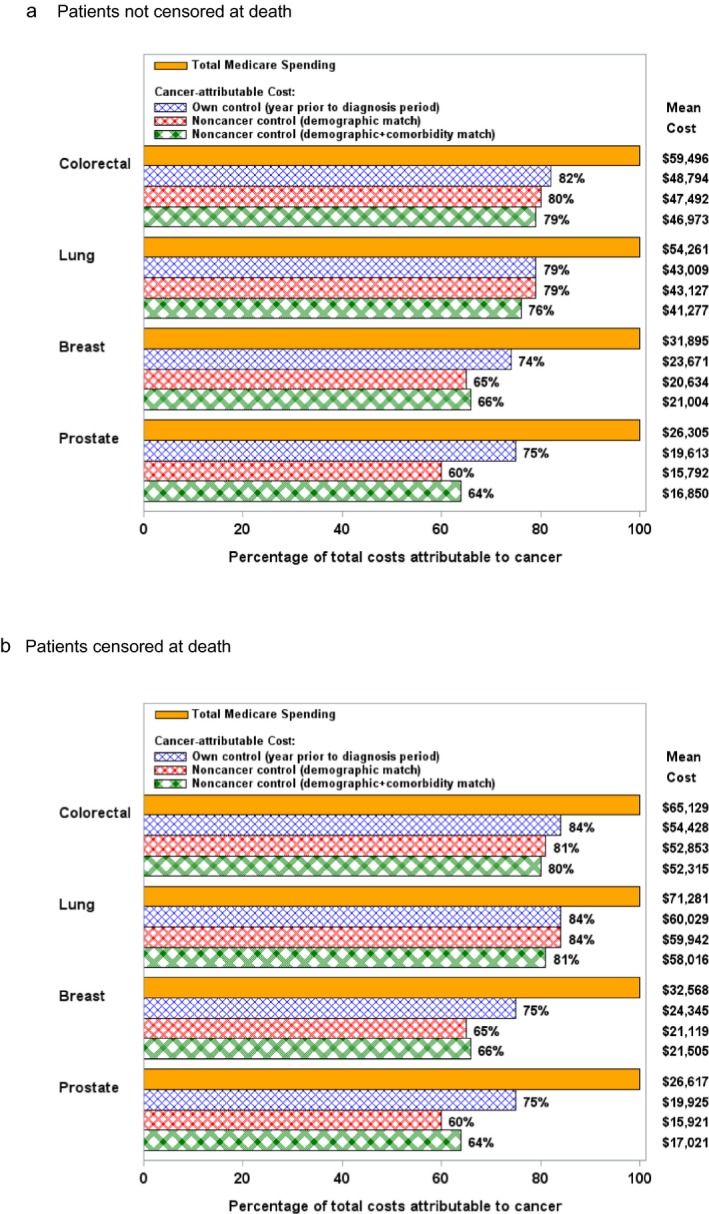
Mean Total Costs Attributed to Cancer, by Comparison Cohort Used [Color figure can be viewed at http://wileyonlinelibrary.com]
Notes. Mean cancer‐attributable costs have been adjusted to 2013 U.S. dollars. Mean difference in cancer‐attributable costs across the three comparison cohorts were compared by t‐test for the noncensored analysis (i.e., dying patients remaining in the denominator for all months) and by bootstrapping with 1,000 replicates for the censored analysis (i.e., dying patients removed from the denominator after their month of death). For the noncensored analysis, all p‐values for comparisons between comparison cohort pairs were ≤.01, except the comparison between own control versus noncancer control by demographic match (p = 0.6) and the comparison between noncancer control by demographic match versus demographic + comorbidity match (p = .02) for lung cancer. For the censored analysis, all p‐values for comparisons between comparison cohort pairs were ≤.01.