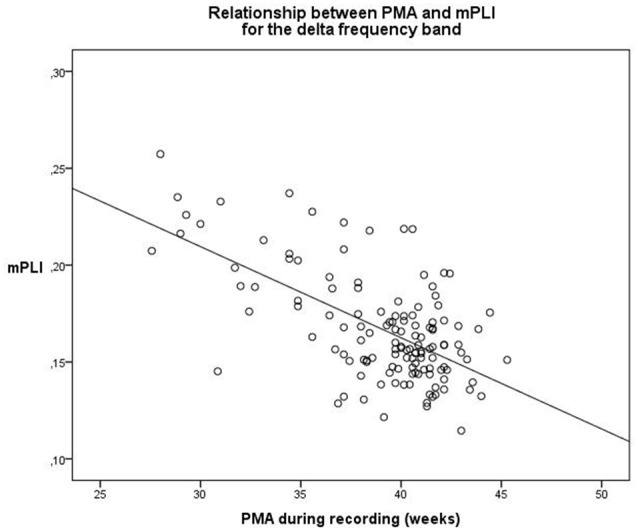
Figure 1.

Relationship between PMA and mPLI in the delta frequency band. The linear relationship between PMA and PLI is shown for the regression model, with B0 = 0.344 and B1 = −0.005. Dots correspond to individual subjects (N = 131). PMA = postmenstrual age, mPLI = mean phase lag index.
