Figure 2.

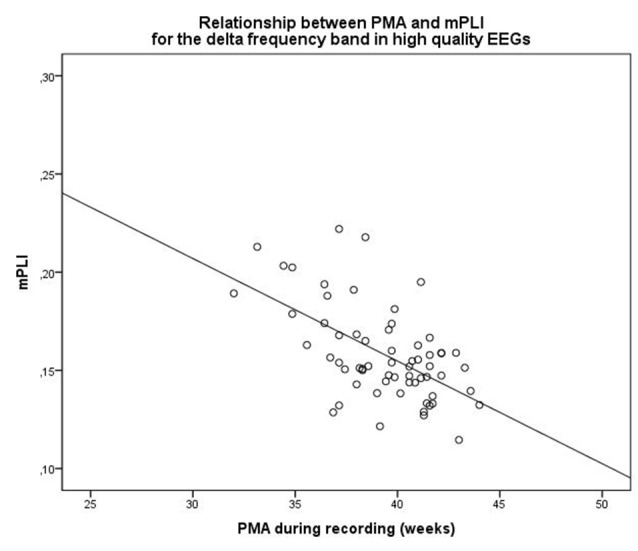
Scatterplot of PMA and mPLI in the delta frequency band, in a subgroup of subjects with EEGs assessed as high quality. Dots correspond to individual subjects (N = 63). PMA = postmenstrual age, mPLI = mean phase lag index.

Scatterplot of PMA and mPLI in the delta frequency band, in a subgroup of subjects with EEGs assessed as high quality. Dots correspond to individual subjects (N = 63). PMA = postmenstrual age, mPLI = mean phase lag index.