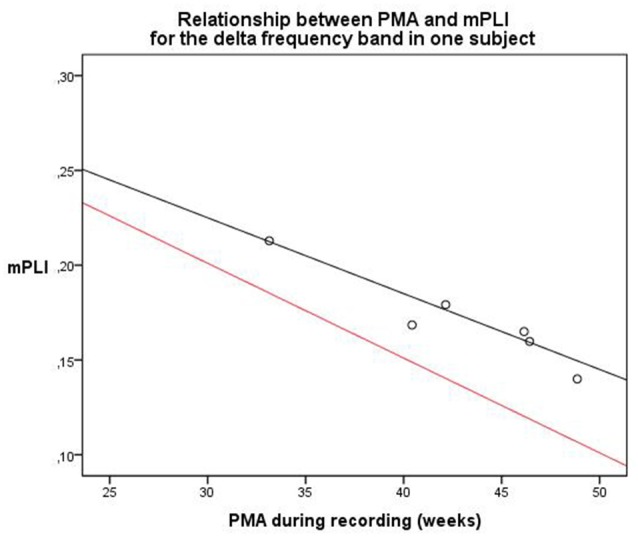
Figure 5.

Relationship between PMA and mPLI in the delta frequency band in one subject at six different time points. The equation line of the resulting linear regression model is shown in black. The equation line of the regression model of the relation between PLI and PMA of the total group, based on the cross-sectional data, is shown in red as a reference. PMA = postmenstrual age, mPLI = mean phase lag index.
