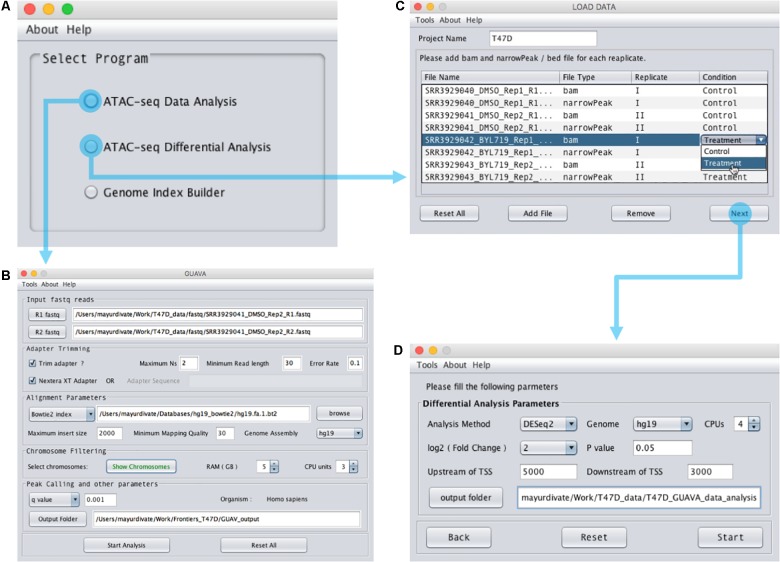
FIGURE 2.
Design of the GUAVA input interface. (A) The main GUAVA window where users select the program they wish to use (ATAC-seq data analysis or ATAC-seq differential analysis). (B) Window for using ATAC-seq data analysis. To perform ATAC-seq data analysis, users load the sequencing data using the R1 fastq and R2 fastq buttons. Next, they choose between Bowtie and Bowtie2 from the drop-down menu in the “Alignment Parameters” section. If required, users can change the other parameters from the default value to another value. For example, the default RAM used for GUAVA is 1 GB but it can be changed if desired. Finally, to run the analysis users simply click the “Start Analysis” button. (C) Window for using ATAC-seq differential analysis. To perform ATAC-seq differential analysis, users set the project name, load the bam and bed files and then set the differential analysis parameters in (D) before selecting the “Start” button.

