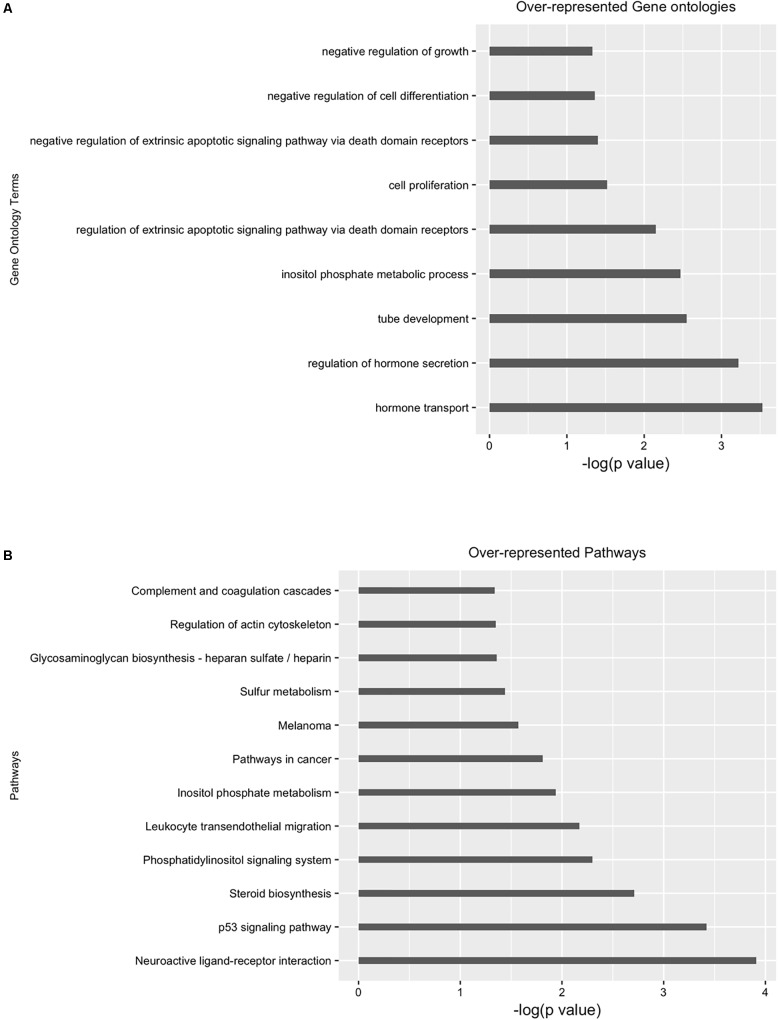
FIGURE 5.
Gene ontology (GO) and pathway analysis of differential enriched peaks. Differentially enriched peaks from Figure 4 were annotated with nearest downstream genes. Then these genes are used to perform (A) gene ontology and (B) pathway analysis.

