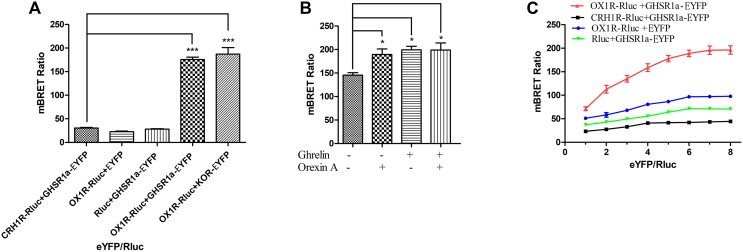
FIGURE 2.
Heterodimerization of GHSR1a/OX1R examined with BRET assay in live cells. Heterodimerization of GHSR1a/OX1R was measured by BRET. HEK293 cells were transiently transfected with the donor plasmids and acceptor plasmids. Twenty-four hours after transfection, both the fluorescence and luminescence of each sample were measured prior to every experiment to confirm equal expression of Rluc while monitoring the increase in Venus expression. (A) BRET ratios were analyzed and are expressed as the means ± SEM (N = 3) of four experiments. ∗∗∗p < 0.001, OX1R-Rluc+ GHSR1a-EYFP vs. control groups (CRH1R-Rluc/GHSR1a-EYFP), as a positive control group (OX1R–Rluc/κOR-EYFP). (B) Effects of ghrelin and/or orexin-A on the BRET ratio. HEK293 cells were co-transfected with OX1R-Rluc and GHSR1a-EYFP plasmids (1:3). After 24 h of transfection, the Rluc substrate Coelenterazine h was added for 5 min, and the cells were treated with ghrelin (100 nM) and/or orexin-A (100 nM) or vehicle for 10 min, BRET ratios were analyzed and are expressed as the mean ± SEM of four experiments. ∗p < 0.05 compared with the control group (no treated). (C) BRET saturation assay. HEK293 cells were co-transfected with a constant amount of the OX1R-Rluc construct, each at 0.15 μg/well, and increasing amounts of the EYFP construct (0.15–1.2 μg/well). Calculated BRET ratios were plotted relative to total fluorescence/luminescence ratios, and the data were analyzed by non-linear regression curve fitting (one site–specific binding) using GraphPad Prism software. BRET ratios were analyzed and are expressed as means ± SEM (N = 3) of four experiments.

