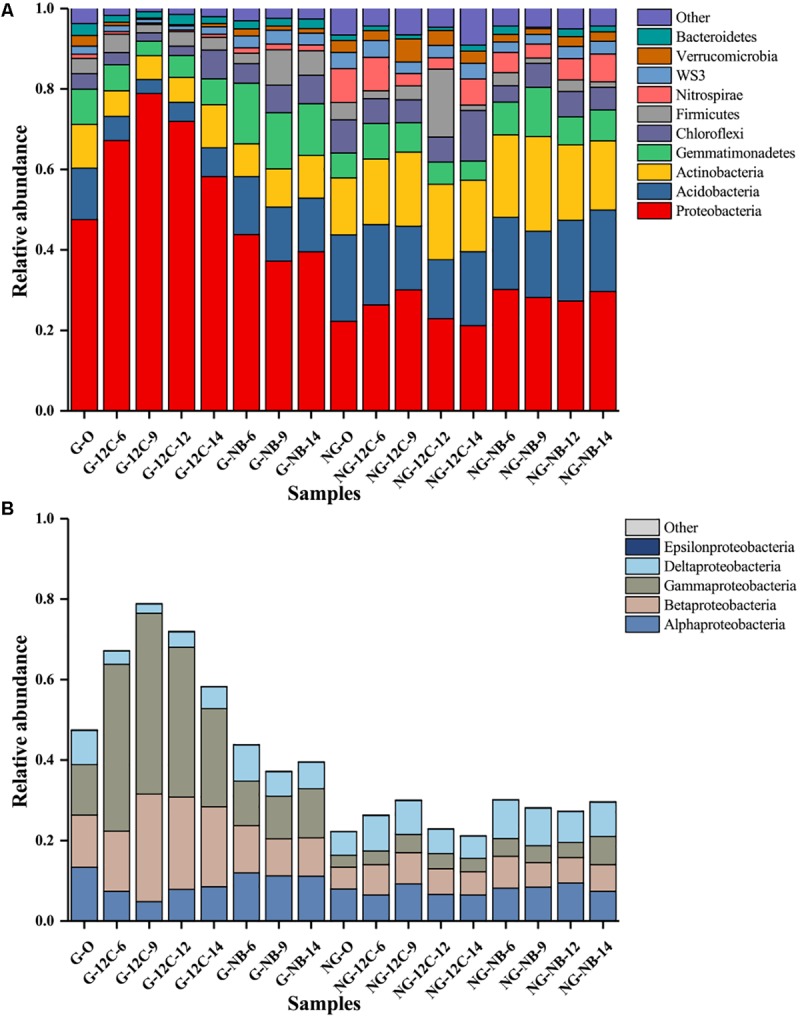
FIGURE 2.

Relative abundance of the top 10 phyla (A) and proteobacterial classes (B) in samples based on 16S rRNA genes sequences. G, samples from gas field; NG, samples from non-gas field; O, original samples without incubation; NB, incubated without butane; 12C, incubated with 12C-butane.
