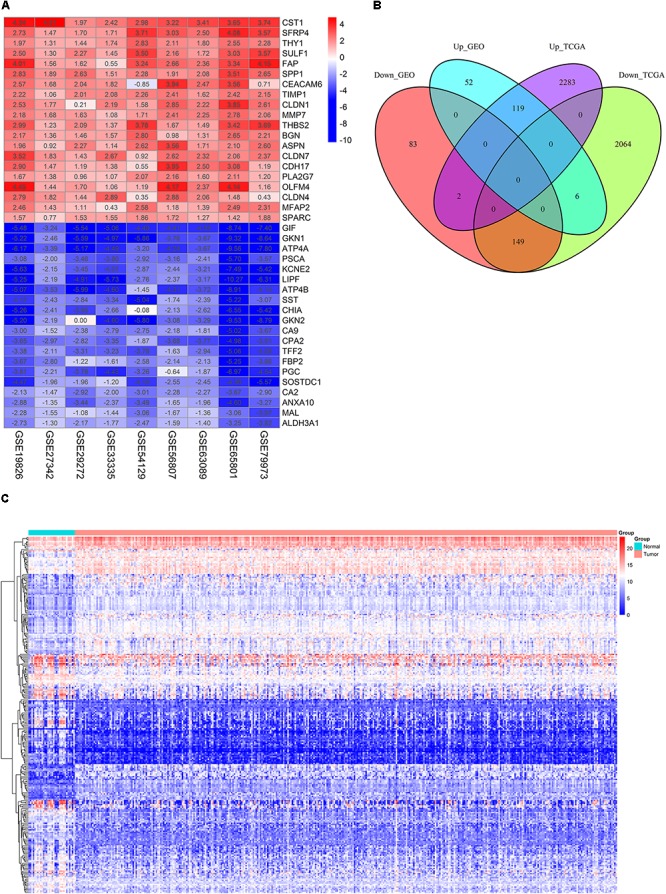
FIGURE 1.

Identification of DEGs. (A) The heat map of top 20 down- and up-regulated DEGs in the integrated microarray analysis. Each column represents one dataset and each row represents one gene. The number in each rectangle represents the value of log2FC. The gradual color ranging from blue to red represents the changing process from down- to up-regulation. (B) Venn diagrams of the DEGs between the integrated nine GEO datasets and the TCGA GC dataset. (C) The heat map of 268 overlapping DEGs in GC and normal gastric tissues (TCGA dataset). Each column represents one sample and each row represents one gene. The gradual color ranging from blue to red represents the changing process from down- to up-regulation.
