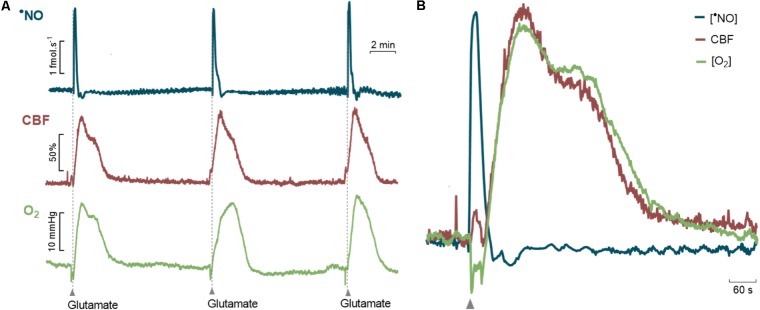
FIGURE 3.
Glutamate-induced changes in •NO, Cerebral Blood Flow and O2 in the dentate gyrus of the hippocampus of anesthetized F344 rats. (A) Representative recording of amperometric signals of •NO (blue line), cerebral blood flow (red line) and amperometric signals of O2 (green line) during glutamatergic activation. Glutamate (0.5 nmol, 1 s) was locally applied by pressure ejection at the time indicated by the upward arrows. (B) Detailed temporal correlation between the dynamic changes in the •NO concentration, CBF and O2 tension.

