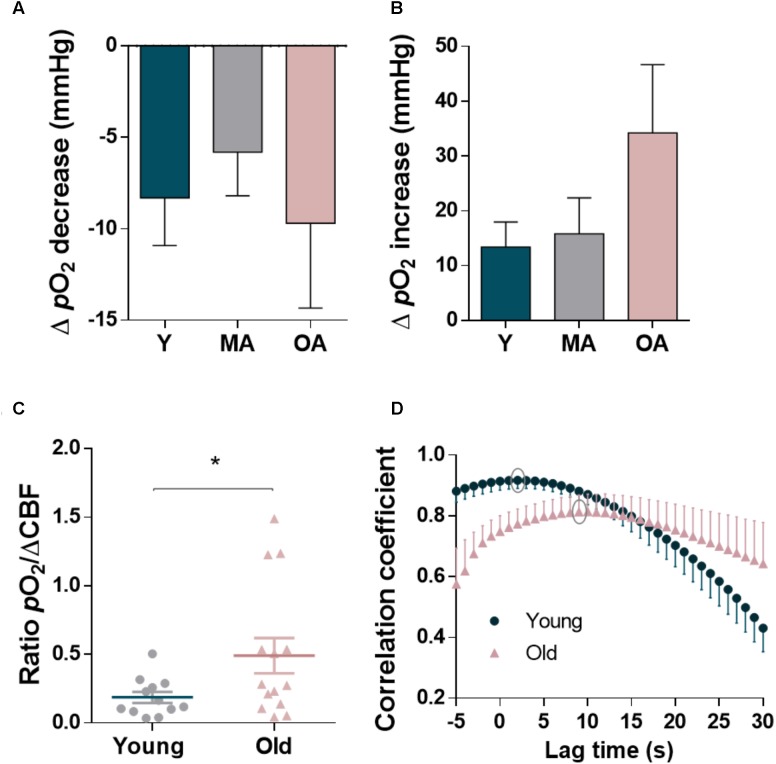
FIGURE 5.
Quantitative analysis of biphasic changes in oxygen tension coupled to the glutamatergic activation in the dentate gyrus of hippocampus of F344 rats along aging and relationship with cerebral blood flow changes. (A) Average decrease in ΔpO2 in the initial component of the signal and (B) average increase in ΔpO2 in the later phase coupled to the CBF increase. Each bar represents mean ± SEM. ∗p < 0.05. (C) Ratio of the pO2 change to the CBF change in young and old-aged animals. (D) Cross-correlation analysis of the time course of CBF and O2 dynamics elicited by glutamate in young and old-aged animals. Average strongest correlation (grey circles) was found at 2 s and 9 s delay of O2 relative to CBF in young and old rats, respectively. All the values represent the mean ± SEM. ∗p < 0.05.

