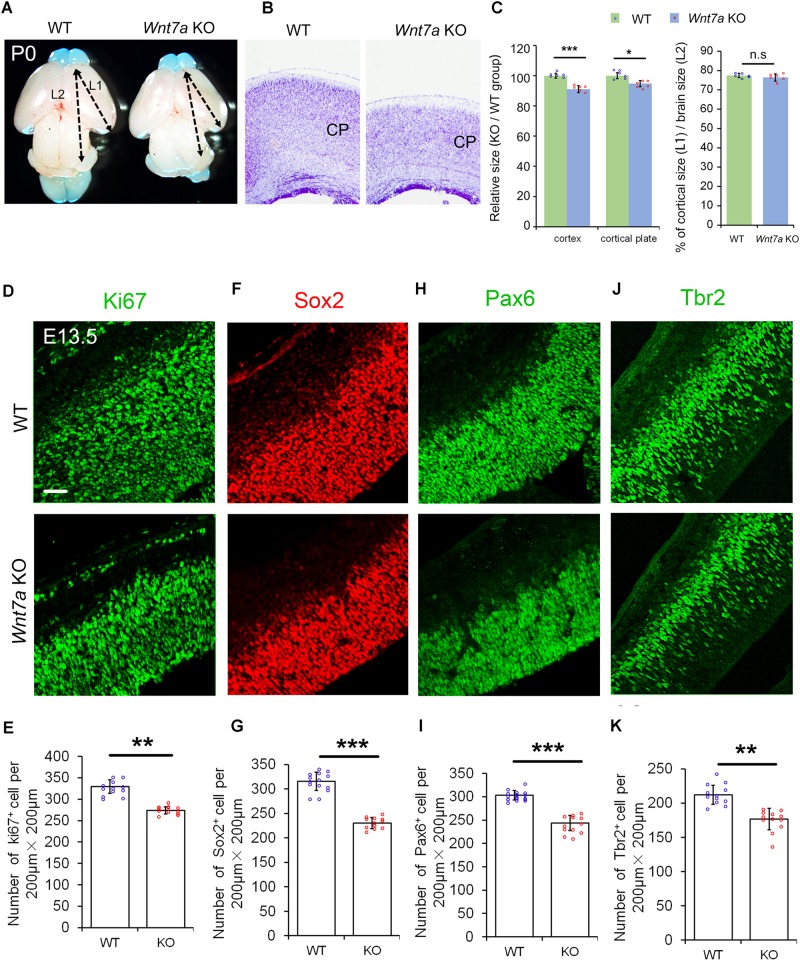
FIGURE 2.
Wnt7a positively regulates brain size and proliferation of NPs. (A) The cortex of P0 Wnt7a knockout (KO) mice was greatly reduced compared to wild type (WT) controls. The arrowheads show the most rostral and caudal regions in the cortex. “L1” represent the cortical length, and “L2” represent the brain length. (B) The cortical wall in P0 Wnt7a KO mice were thinner than that in WT mice, detected by Nissl staining. CP: cortical plate. (C) The relative thickness of the cortex and cortical plate in the KO was normalized from dividing the mean length of Wnt7a KO by that of the WT groups. Values of histogram represent mean ± SEM, and each dot represents a data point of the relative thickness in each section or length in the brain images. n = 3 brains, at least two sections from each brain. ∗P < 0.05;∗∗∗P < 0.001; ns, non-significant; unpaired Student’s t-test. (D–K) The numbers of Pax6+ and Tbr2+ neural progenitors were greatly reduced in the E13.5 Wnt7a KO cortex. Values of histogram represent mean ± SEM, and each dot represents a data point of the counting number in each section (200 μm bin). n = 3 brains, at least four sections from each brain. ∗∗P < 0.01; ∗∗∗P < 0.001; unpaired Student’s t-test). Scale bar: 50 μm.

