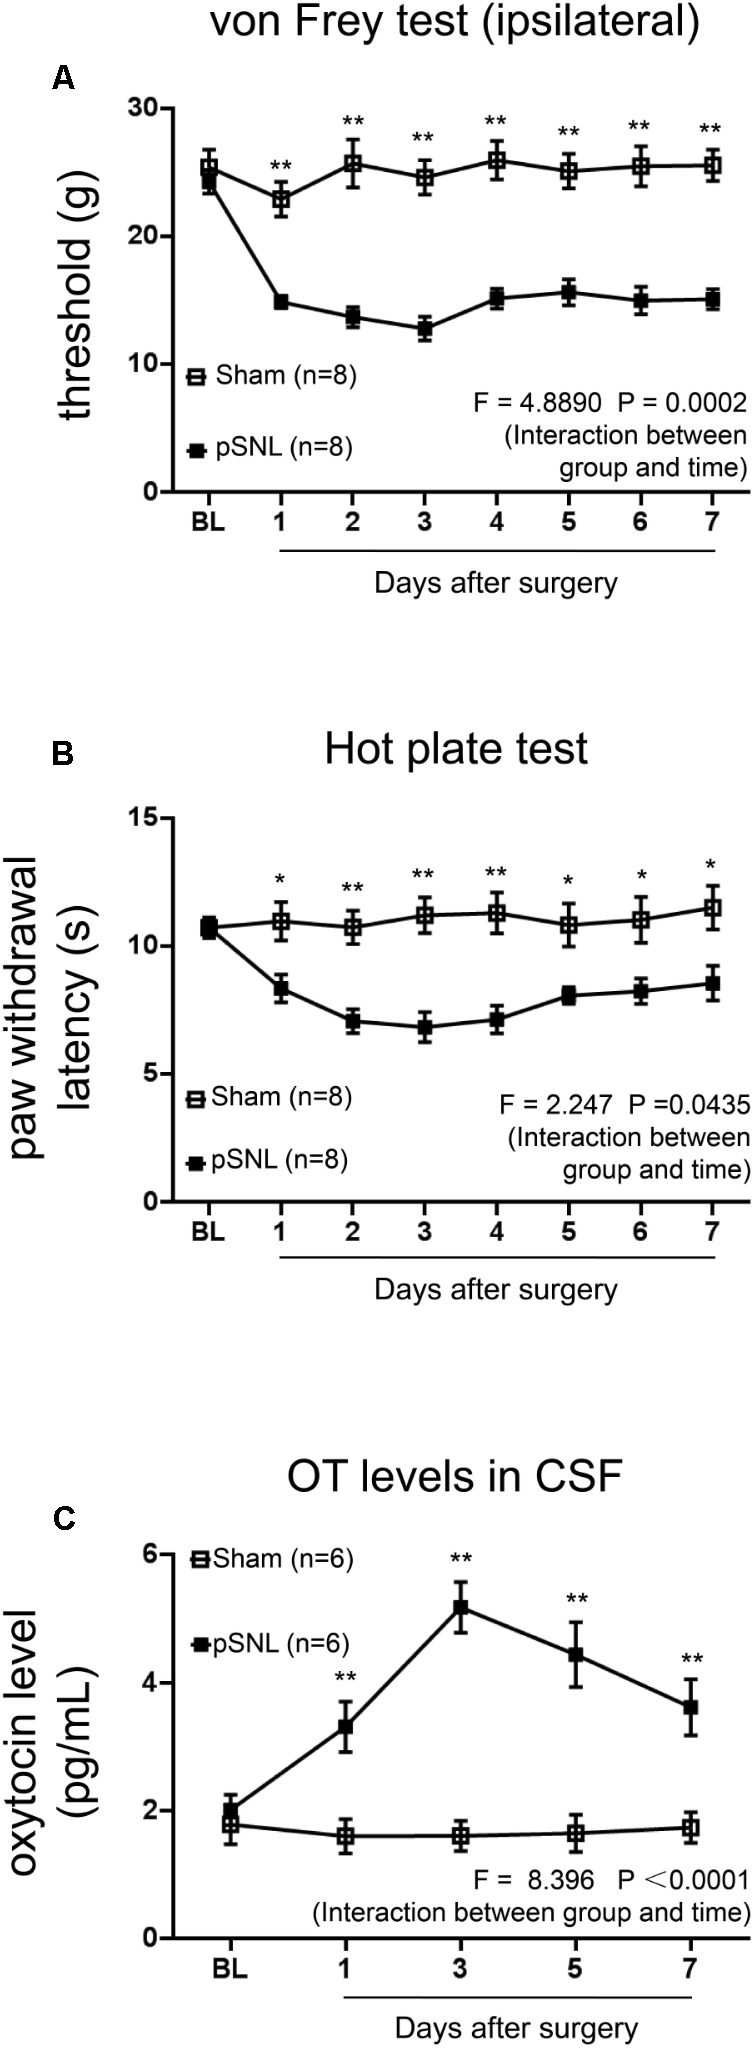
FIGURE 1.

Behavioral tests and OT concentrations in CSF in rats after pSNL. (A,B) Mechanical (A) and thermal tests (B) in rats from sham and pSNL groups, n = 8. (C) OT concentrations in cerebrospinal fluid (CSF) of rats from sham and pSNL groups, n = 6. Mean ± SEM, ∗P < 0.05, ∗∗P < 0.01 vs. sham group at the same time point. Repeated measures ANOVA followed by Dunnett’s post hoc test were performed; statistical differences by Dunnett’s post hoc test were shown.
