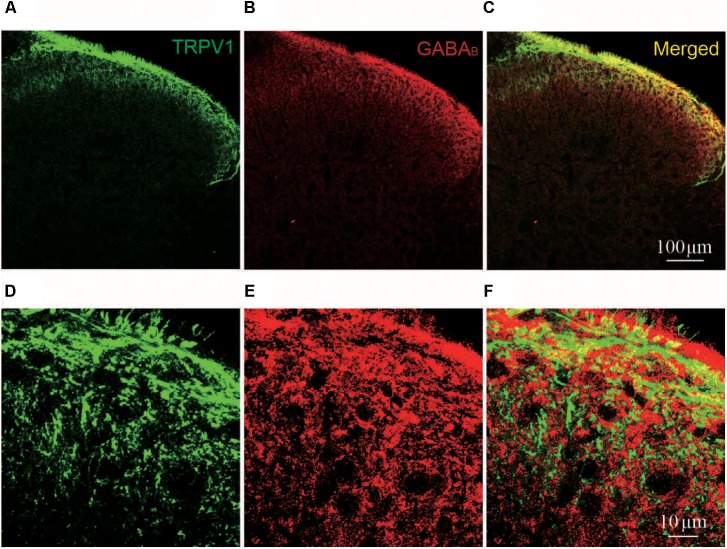
FIGURE 5.
Immunofluorescent staining of TRPV1 and GABAB in spinal cord. (A–C) Representative images of immunofluorescent staining of TRPV1 (green, A); GABAB receptor (red, B); and merged TRPV1 and GABAB receptor (yellow, C) in spinal cord of naïve rat. (D–F) Magnified images of immunofluorescent staining of TRPV1 (green, D); and GABAB receptor (red, E); and merged TRPV1 and GABAB receptor (yellow, F) in spinal cord of naïve rat.

