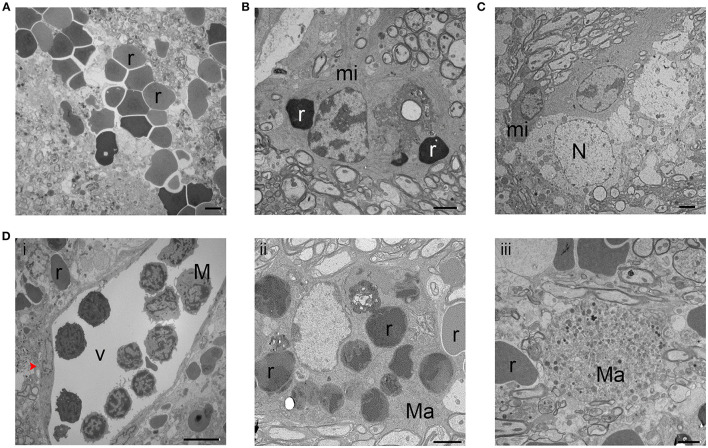
Figure 4.
Microglia and monocyte-derived macrophages at 3 days after intracerebral hemorrhage. (A) Bleeding in the brain tissue is evident by the presence of red blood cells (r). (B,C) Reactive phagocytic microglia (mi) are shown engulfing red blood cells (r) and necrotic neurons (N). (D) A blood vessel (V) is shown with white blood cells, including monocytes (M). Red arrowhead indicates a blood vessel endothelial cell (i). Macrophages (Ma) can be seen phagocytosing red blood cells (r) (ii) and other debris (iii). Scale bars: (A–C,Dii,iii) 2 μm; (D) 10 μm. n = 6 animals per group.

