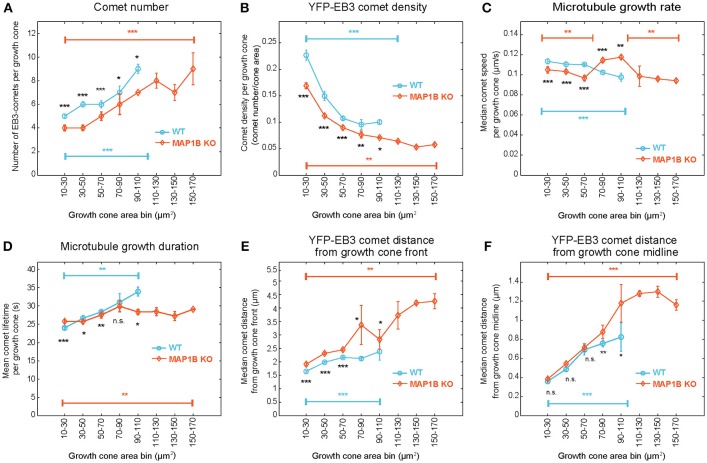
Figure 3.
EB3-comet associated features scale with growth cone size both in wild-type and MAP1B-null growth cones. Wild-type (blue) and MAP1B-null (orange) growth cone populations were stratified according to increasing growth cone area bins (interval: 20 μm2). The largest size bins (110–170 μm2) only contain MAP1B-null growth cones. EB3-YFP comet number increases (A) while comet density (B) and microtubule growth rate (C) are decreasing with increasing growth cone size, and significantly differ between each wild-type and MAP1B-null growth cone area bins. Microtubule growth duration (D), comet distance from growth cone front (E) and comet distance from growth cone midline (F) are increasing with increasing growth cone size. Median property values and their 95% confidence intervals are displayed. Number of observations is displayed in Figure S4. *p < 0.05, **p < 0.01, ***p < 0.001, n.s., non-significant; according to Wilcoxon rank-sum test.

