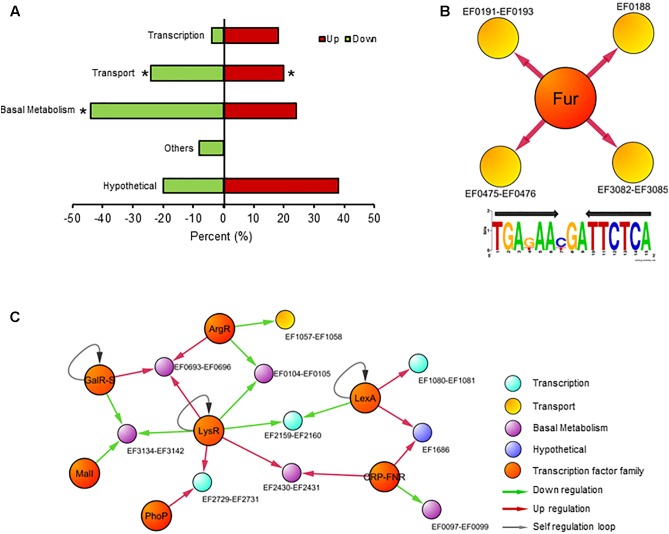
FIGURE 3.
Transcriptional response in the absence of Fur. (A) Global transcriptional analysis of E. faecalis wild type and Δfur growing in the iron control condition. RNAseq differentially expressed genes classify by COG super-class categories. Color bars represent the upregulated or downregulated genes in Δfur compared to the wild type. Asterisk denotes significant enrichment in the bacterial genome (p (0.05) compared to total proportion. (B) Fur regulon of E. faecalis. Consensus logo of Fur regulon created with Fur DNA sequence found in promoters of EF0188, EF0191–EF0193, EF475–EF0476, and EF3082–EF3085 operons (the black arrow indicates palindromic sequence). (C) The graph contains 23 nodes (14 operons, 8 transcription factor families) connected by 26 edges (putative binding sites). Color circles represents COG super-class categories.

