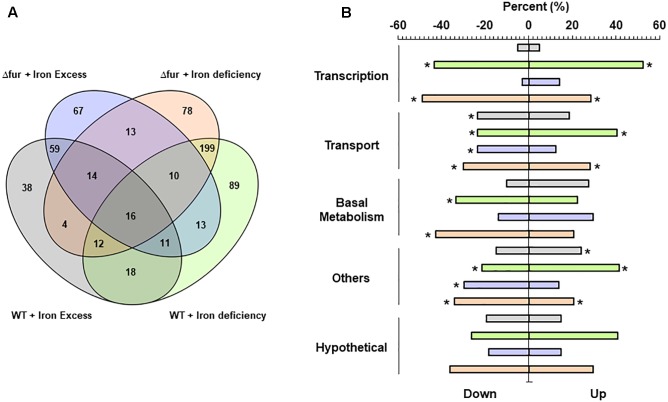
FIGURE 4.
Global transcriptional analysis of E. faecalis wild type and Fur mutant growing at different iron treatments. (A) Venn diagrams. Numbers indicate the total genes activated on each condition. (B) RNAseq differentially expressed genes classify by COG super-class categories. Color bars represent the two E. faecalis strains growing under iron excess or deficiency. Asterisk denotes significant enrichment (p (0.05) compared to the total proportion in the bacterial genome.

