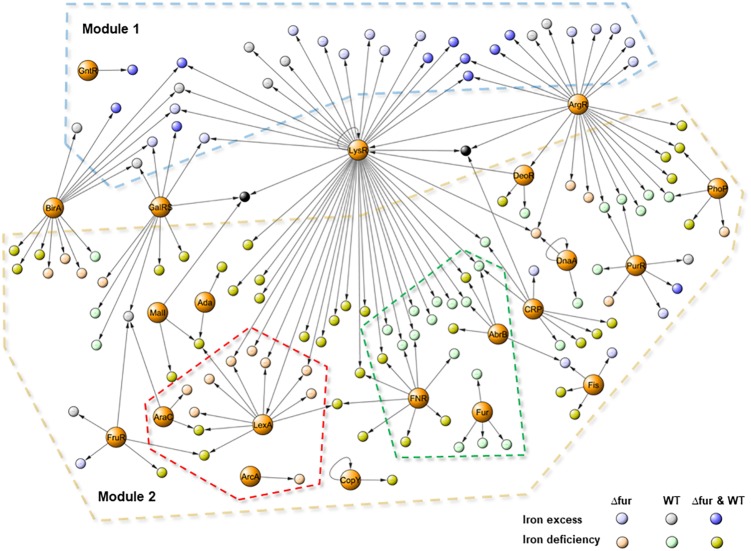
FIGURE 5.
Transcriptional regulatory network activated by iron excess and deficiency in E. faecalis wild type and Δfur (Fur mutant). The graph contains 153 nodes (139 activated operons and 21 family of regulators) connected by 181 edges (putative binding sites). Color circles represent differentially expressed responses of each operon in the RNAseq experiment. Dash lines indicate: Module 1 (iron excess) in light blue, Module 2 (iron deficiency) in light brown, wild type sub-network in light green and Δfur in light pink.

