Figure 6.

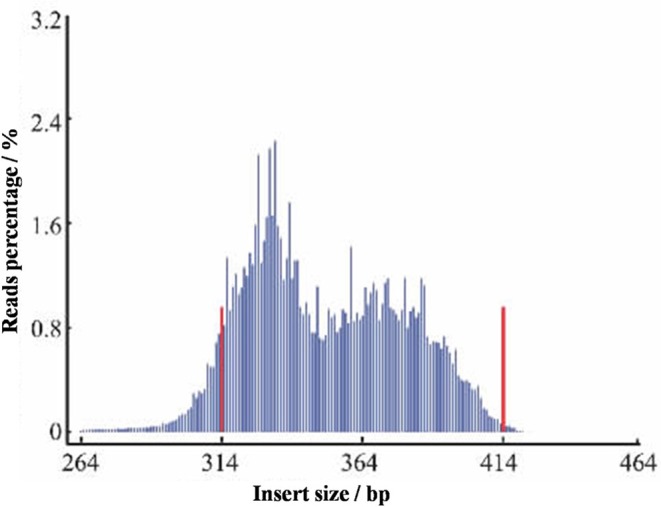
Distribution map of the insert fragment. The x-axis represents the length of the inserted fragment of reads, and y-axis represents the number of reads.

Distribution map of the insert fragment. The x-axis represents the length of the inserted fragment of reads, and y-axis represents the number of reads.