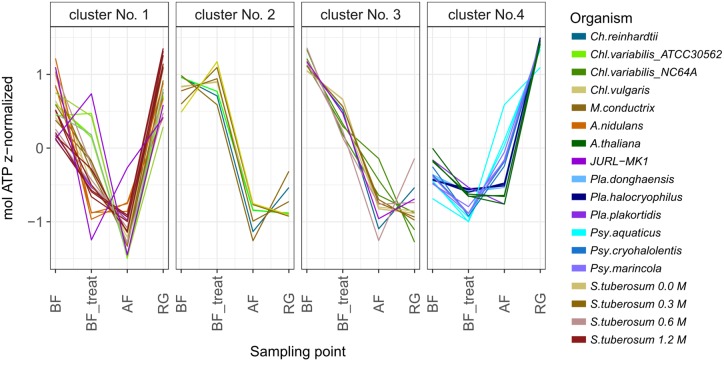
FIGURE 3.
Patterns of changes in intracellular ATP content observed for different organisms during cryostress. The pattern of ATP content observed under cryrostress for each strain or organism was fitted to different shapes employing the R package dtwclust. This analysis resulted in clusters of strains or organisms that could be assigned to four different shapes (Supplementary Figure S2). BF, before freezing; BF_treat, after treatment with cryoprotectant; AF, after freezing; RG, after the regrowth phase. Pla., Planococcus; Psy., Psychrobacter; Ch., Chlamydomonas; Chl., Chlorella; Mic., Micractinium; A. nidulans, Aspergillus nidulans; A. thaliana, Arabidopsis thaliana Col-0 shoot tips; S. tuberosum, Solanum tuberosum cv. Desiree suspension cells after pretreatment with different sorbitol concentrations.

