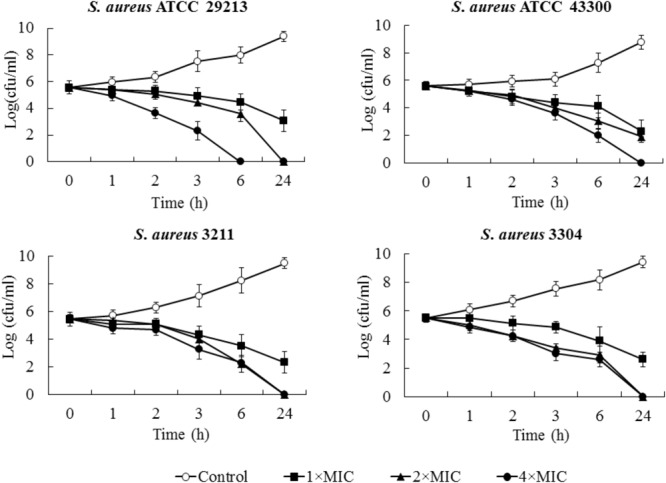
FIGURE 2.

Time-kill curves for Staphylococcus aureus treated with different concentrations of blestriacin. The curves are viable cell concentrations plotted against time. Open circles, nondrug control; closed squares, 1× MIC of blestriacin; closed triangles, 2× MIC of blestriacin; closed circles, 4× MIC of blestriacin. MIC, minimum inhibitory concentration. Data represent the mean ± SD (n = 3).
