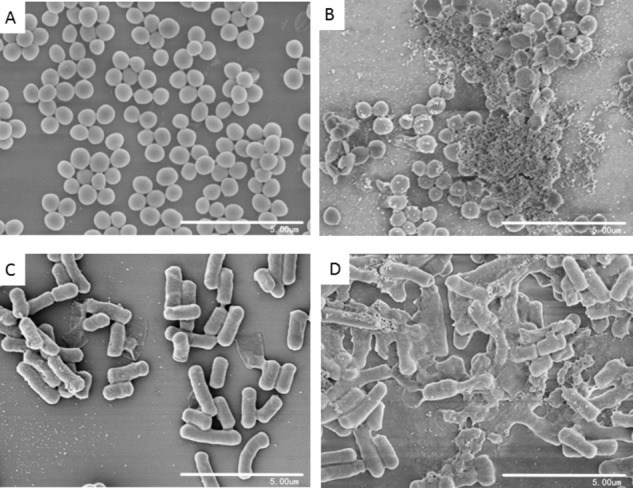
FIGURE 5.

Scanning electron microscopic analysis of bacteria. (A) and (C): Represent cells of S. aureus ATCC 29213 and B. subtilis 168 without treatment at magnifications of 10000×, respectively. (B) and (D): Cells of S. aureus ATCC 29213 and B. subtilis 168 incubated with 32 μg/mL blestriacin for 3 h at magnifications of 10000×, respectively.
