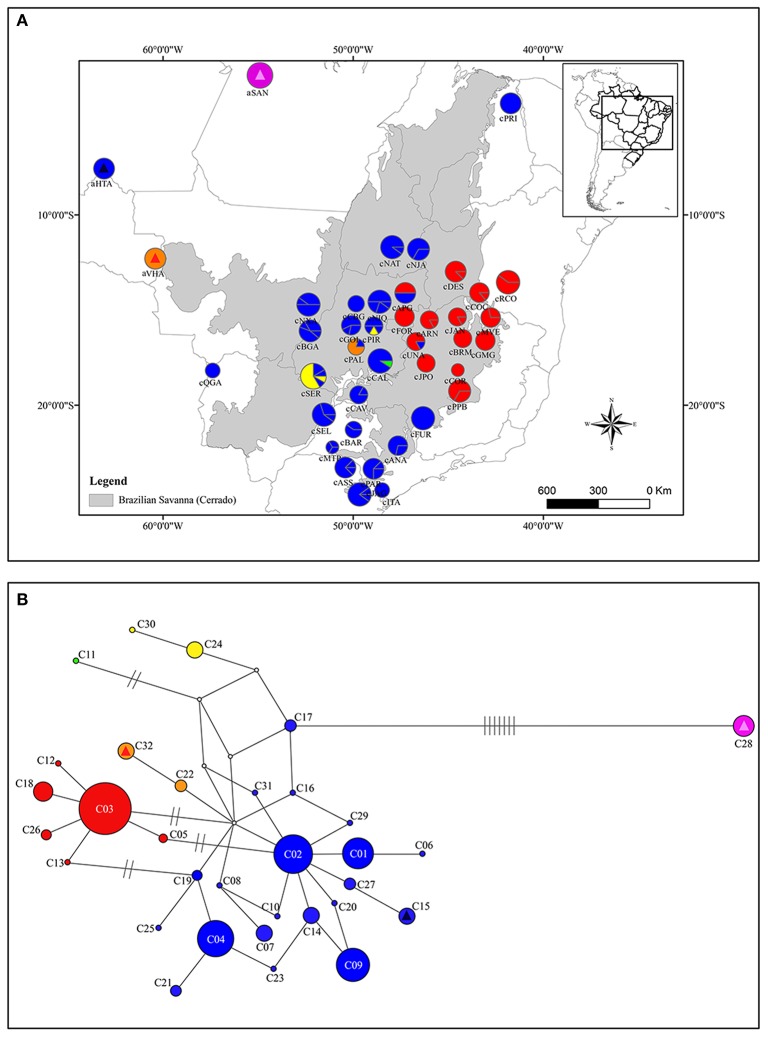
Figure 1.
Geographical distribution of cpDNA haplotypes over sampled area for Qualea grandiflora (A) and Median-joining network showing the relationships between Qualea grandiflora haplotypes based on concatenated cpDNA sequences (B). The map and network colors are the same and the size of the circles in (A,B) is proportional to the number of individuals. Dashes represent the number of mutations separating the haplotypes. Absence of dashes denotes only one mutational step between haplotypes. The triangles represent the haplotypes that are exclusive from Amazonian enclaves and the squares the haplotypes shared with Cerrado core. Each exclusive or shared haplotype has one triangle or square color.

