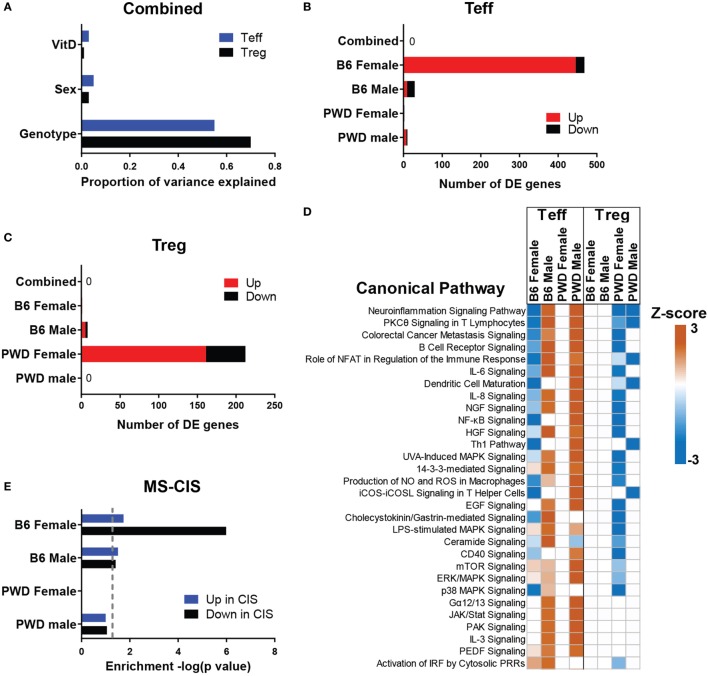
Figure 3.
In vivo transcriptional regulation by vitamin D3 (VitD). Female and male B6 and PWD mice (N = 4 for each sex/strain combination) were exposed to VitD-low and VitD-high diets as in Figure 1. At 5 weeks post-dietary intervention, transcriptional profiling was performed on Teff and regulatory T cells (Tregs) as described in Section “Materials and Methods.” (A) The proportion of variance in gene expression explained by the indicated experimental variables is shown for Teff and Tregs. (B,C) The number of genes passing the differential expression threshold (|Fold Change| > 2, ANOVA p < 0.001) as a function of diet is shown for the indicated groups, in Teff (B) and Tregs (C). Direction of change is depicted as expression level in VitD-high relative to VitD-low (e.g., “up” indicates higher expression in the VitD-high group). (D) Canonical pathway analysis was performed using IPA software (see Materials and Methods). Z-scores indicate predicted direction and relative strength of change (VitD-high relative to VitD-low). The top 30 pathways (ranked by Z-score) are shown. (E) Enrichment analysis of the indicated differentially expressed (DE) gene sets from Teff within transcripts DE (up or down) in CD4 cells from multiple sclerosis (MS)-CIS patients was performed using IPA (see Materials and Methods). p-Values for enrichment are shown as −log(p). Dotted line denotes p = 0.05.

