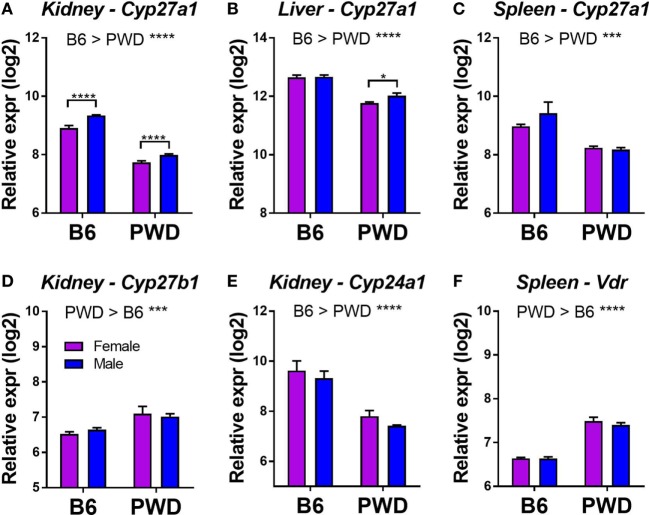
Figure 6.
Tissue-specific differential expression of vitamin D3 metabolic pathway genes in B6 and PWD mice. Gene expression data were obtained from the Gene Expression Miner database, as described in Section “Materials and Methods.” Genes showing a significant differential expression (with a greater than 30% change in expression) as a function of strain or sex are shown in (A–F). The significance of the observed differences was assessed by two-way ANOVA, with Holm–Sidak’s post hoc comparisons: B6 vs. PWD (overall effect of strain; indicated above the graphs), and female vs. male (within strain; indicated with brackets). The data included 12 C57BL/6J mice (6 females and 6 males), and 11 PWD/PhJ mice (6 females and 5 males). Symbols indicate a significant difference between the indicated groups, as follows: *p < 0.05; **p < 0.01; ***p < 0.001; ****p < 0.0001.

