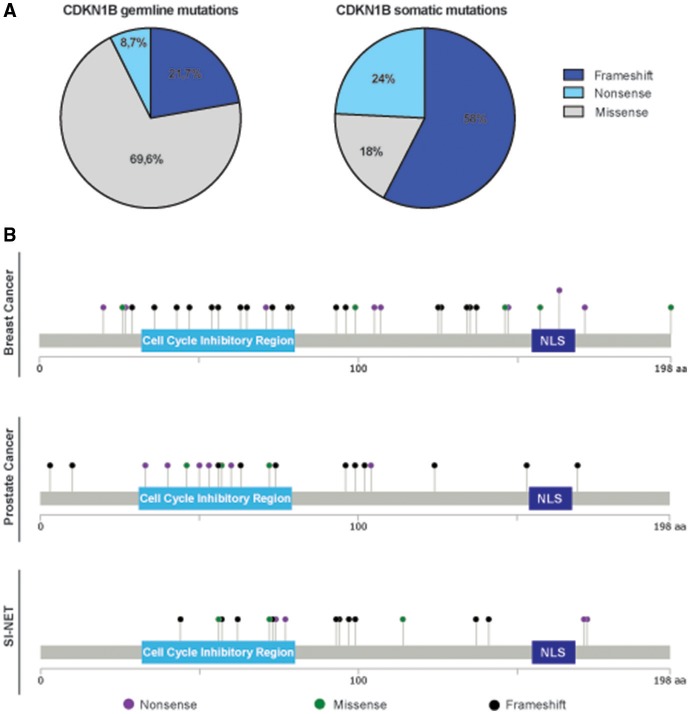
Figure 2.
Distribution of germline and somatic CDKN1B mutations. (A) Pie graphs report the distribution of germline mutations in hereditary syndromes (left) and somatic ones in sporadic cancers (right). The percentage of each type of pathogenic variant (frameshift, including both insertion and deletions, missense, and nonsense) is reported. (B) Distribution of mutations identified in breast cancer (top), prostate cancer (middle), and SI-NET (bottom) are depicted along the sequence of p27 protein.

