Figure 1.

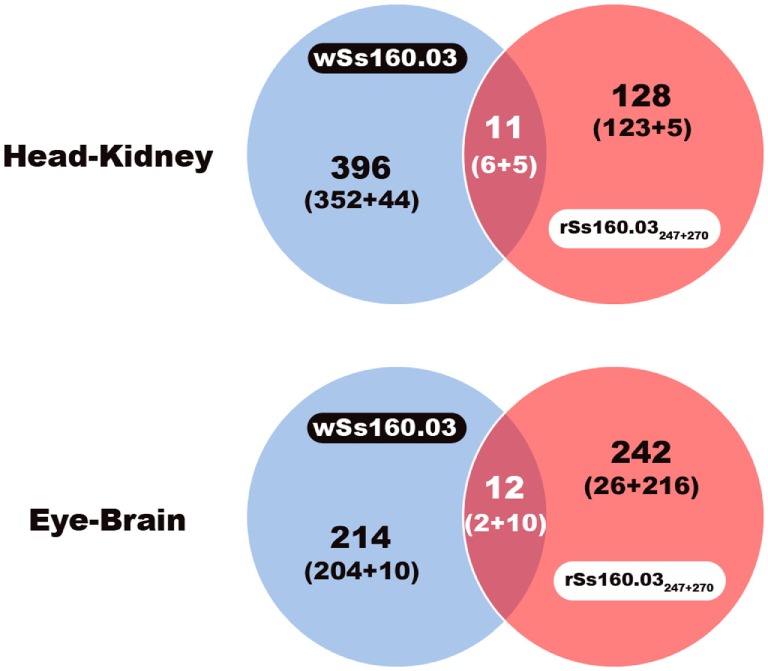
Venn diagram of DEGs using edgeR. Common and different DEGs detected after infection with the wild-type and mutant reassortants in head kidney and nervous tissue. Number of DEGs: upregulated + downregulated.

Venn diagram of DEGs using edgeR. Common and different DEGs detected after infection with the wild-type and mutant reassortants in head kidney and nervous tissue. Number of DEGs: upregulated + downregulated.