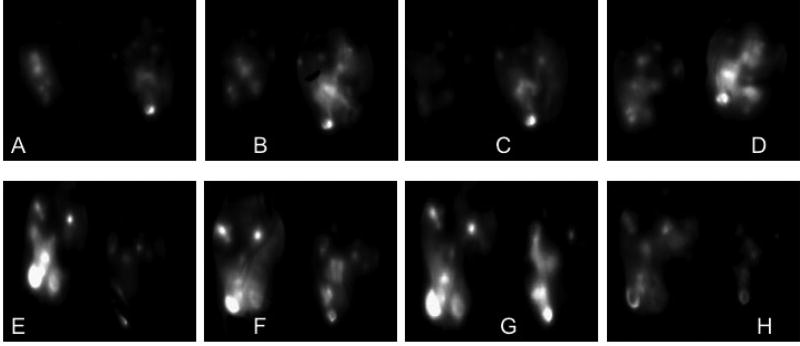
Figure 7. In vivo Bioluminescence luciferase imaging.
Bioluminescence images of luciferase knockdown in vivo after injection of luciferase siRNA containing FRα targeted micelleplexes (A–D) and scramble siRNA containing FRα targeted micelleplexes (E–H). Time points displayed here are 0 hours (A, E), 24 hours (B, F), 48 hours (C, G), and 72 hours (D, H). Luciferase activity is shown predominantly in the primary tumor as well as in metastases.

