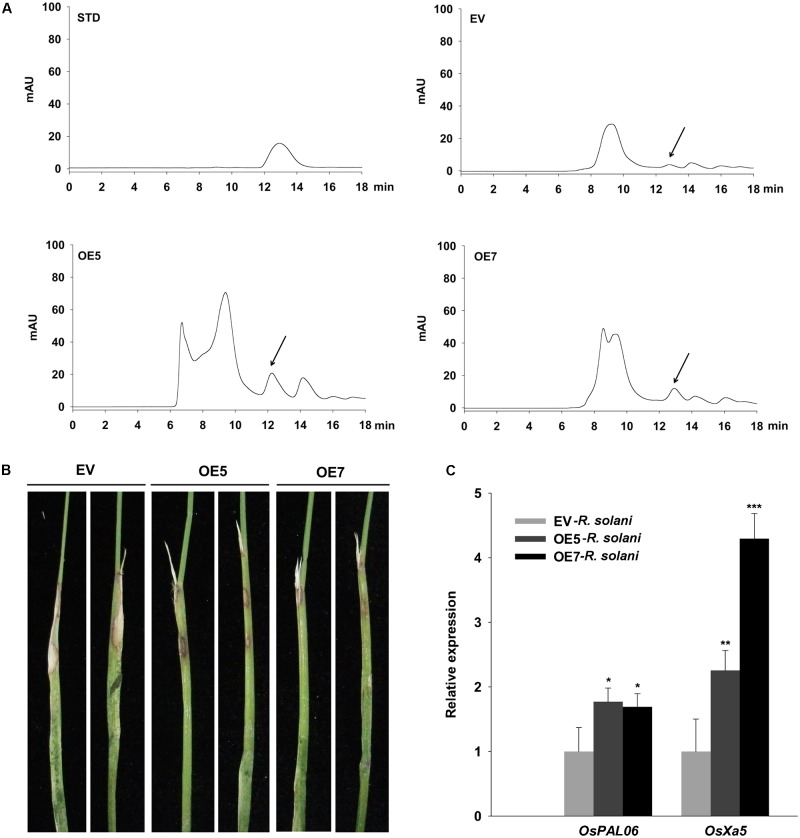
FIGURE 6.
Functional analysis of the ZmNBS25 gene in rice. (A) Chromatogram of SA extracted from ZmNBS25-OE and control (EV) rice plants without pathogen inoculation. STD represents standard SA; mAU indicates peak height. The arrow indicates the SA peak. (B) Resistance of ZmNBS25-OE plants to rice sheath blight. (C) Expression levels of defense related genes in ZmNBS25-OE and control plants inoculated with Ralstonia solani. Data were normalized using the transcript level of Ostubulin and 18srRNA. OE5 and OE7 represent two different transgenic lines of ZmNBS25-overexpressed rice. The expression levels of genes in R. solani-infected EV plants were used as controls and assigned the value of 1. Asterisks indicate statistically significant differences between treated and untreated maize by Student’s t-test (∗P< 0.05, ∗∗P< 0.01, ∗∗∗P< 0.001). Data represent mean relative expression values ± standard deviation from three independent experiments.

