
Figure 5.
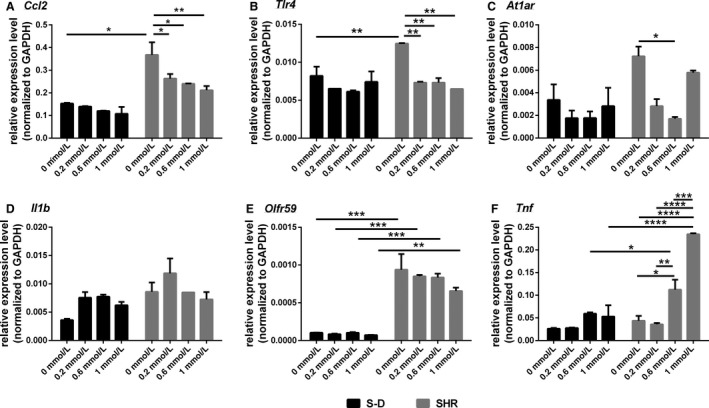
The expression of transcripts related to neuroinflammation in mixed brainstem/hypothalamic astrocyte cultures collected from S‐D and SHR. (A) Ccl2 (B) Tlr4 (C) At1ar, (D) Il1b, (E) Olfr59, and (F) Tnf. Data are presented as mean ± SE (n = 3). Significant differences are indicated among groups, P < 0.05 (*), P < 0.01 (**), P < 0.001 (***).