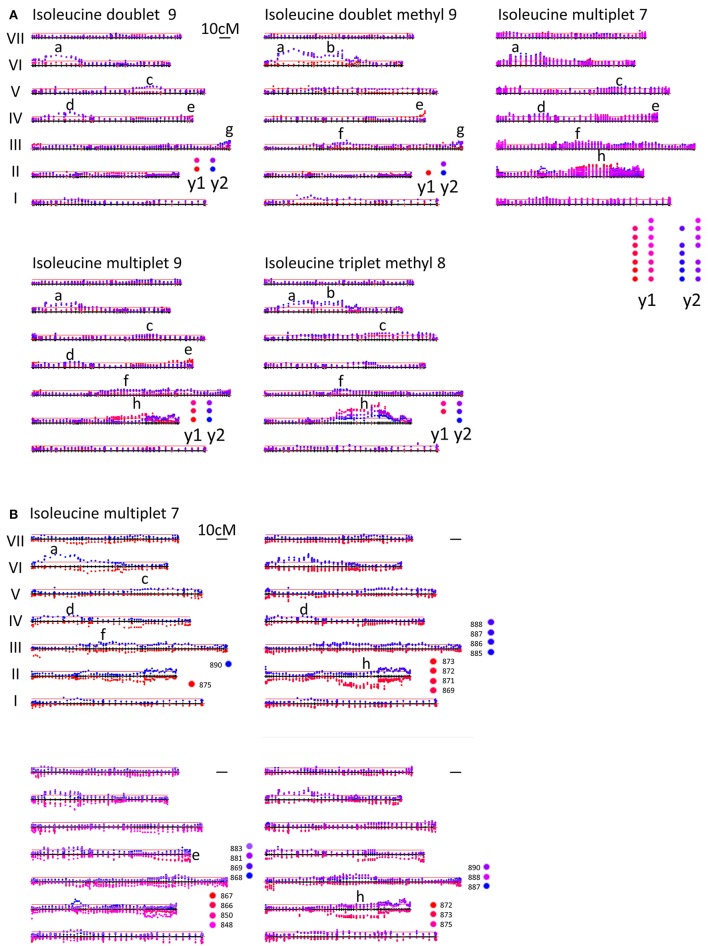
Figure 3.
(A) Mapping variation attributed to isoleucine. LG I–VII of the genetic map of the JI 281 × JI 399 RIL population are displayed horizontally from bottom to top for each isoleucine signal. The –log10 (p)-values for each marker are plotted above the genetic map for NMR resonances associated with different parts of the isoleucine molecule. Different bins are plotted with a slightly different color, those from year 1 in red and those in year 2 in blue. Overall, the identified peaks (labeled a–h) are different between years, with the exception of peak h. The multiple bins assigned to isoleucine multiplet 7 are deconvoluted in (B). Mapping variation attributed to isoleucine multiplet 7. LG I–VII of the genetic map of the JI 281 × JI 399 RIL population are displayed horizontally from bottom to top. The –log10 (p)-values for each marker are plotted above the genetic map for year 2 data and below the genetic map for year 1 data. The color coding for the various bins is indicated adjacent to the relevant map. The bin groupings are according to the correlations given in Supplementary Table 4. The peaks (labeled a–h) correspond to those identified in (A) for isoleucine multiplet 7. The red lines above the map correspond to 3 SD units for the variation in p-values.

