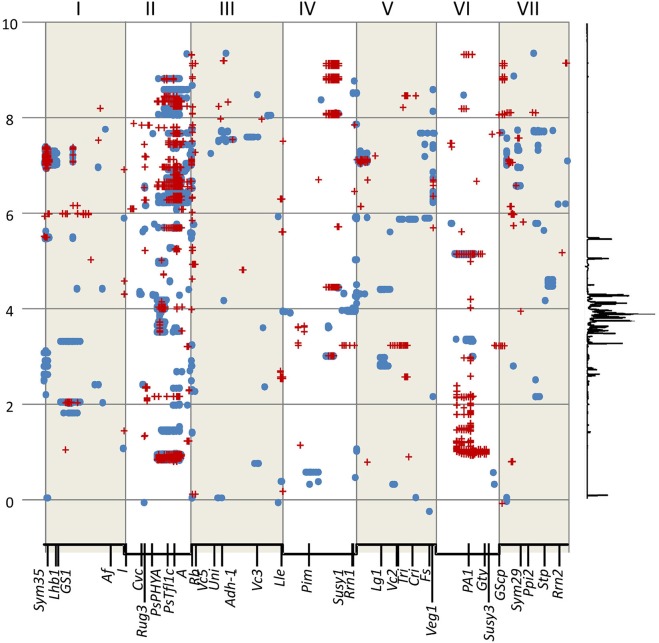
Figure 5.
Significant genetic marker-NMR bin associations in the JI 281 × JI 399 RILs. The x axis represents a concatenated genetic map for LG I–VII in numerical order. Below the axis several reference genetic loci are indicated. The y axis represents the NMR spectrum in ppm. To the right of the graph a representative trace of the NMR spectrum is shown vertically to indicate relative signal intensity. The blue spots represent the upper and lower bounds of a selected year 1 bin and the red crosses are the upper and lower bounds of selected year 2 bins (both JIC location). Bins were selected that had –log10 (p) values greater than the mean plus 5 SD units.

