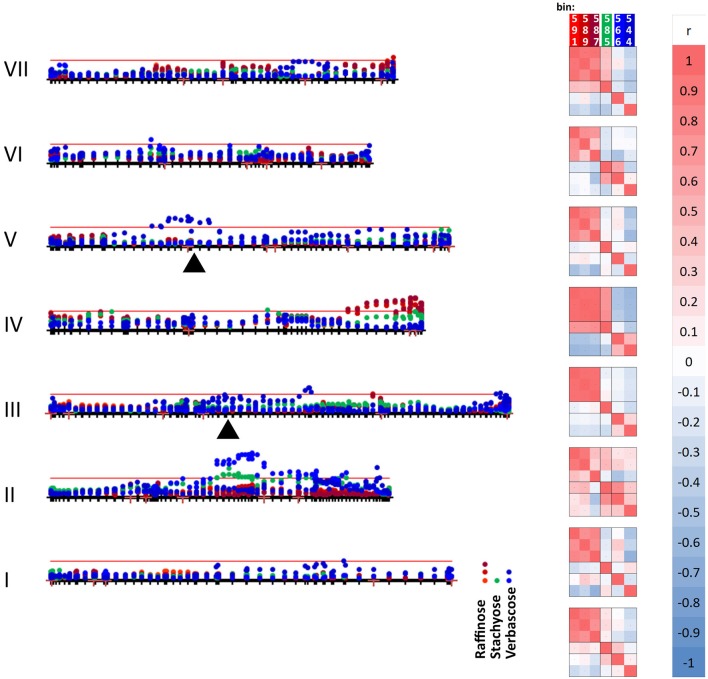
Figure 6.
Mapping variation attributed to oligosaccharides. The seven linkage groups (I–VII) of the JI 281 × JI 399 genetic map are displayed horizontally from bottom to top. The –log10 (p) values for each oligosaccharide bin/marker are plotted above the genetic map (year 1, JIC). The threshold value for p determined from the randomization and t-test is indicated by the red horizontal line. The positions of raffinose synthase and stachyose synthase genes on linkage groups III and V are indicated by black triangles. The three bins assigned to raffinose (591, 589, and 587) are indicated in shades of red, stachyose (585) in green, and the two verbascose bins (566 and 544) in blue. On the right of the genetic map, a correlation analysis of the p-values for each bin within each linkage group is indicated, together with a color scale for the correlation range −1 to +1. At the bottom of the correlation scores, the correlation between the bins for the whole linkage map is given.

